IHOP 2010 Annual Report Download - page 112
Download and view the complete annual report
Please find page 112 of the 2010 IHOP annual report below. You can navigate through the pages in the report by either clicking on the pages listed below, or by using the keyword search tool below to find specific information within the annual report.-
 1
1 -
2
-
3
-
4
-
5
-
6
-
7
-
8
-
9
-
10
-
11
-
12
-
13
-
14
-
15
-
16
-
17
-
18
-
19
-
20
-
21
-
22
-
23
-
24
-
25
-
26
-
27
-
28
-
29
-
30
-
31
-
32
-
33
-
34
-
35
-
36
-
37
-
38
-
39
-
40
-
41
-
42
-
43
-
44
-
45
-
46
-
47
-
48
-
49
-
50
-
51
-
52
-
53
-
54
-
55
-
56
-
57
-
58
-
59
-
60
-
61
-
62
-
63
-
64
-
65
-
66
-
67
-
68
-
69
-
70
-
71
-
72
-
73
-
74
-
75
-
76
-
77
-
78
-
79
-
80
-
81
-
82
-
83
-
84
-
85
-
86
-
87
-
88
-
89
-
90
-
91
-
92
-
93
-
94
-
95
-
96
-
97
-
98
-
99
-
100
-
101
-
 102
102 -
 103
103 -
 104
104 -
 105
105 -
 106
106 -
 107
107 -
 108
108 -
 109
109 -
 110
110 -
 111
111 -
 112
112 -
 113
113 -
 114
114 -
 115
115 -
 116
116 -
 117
117 -
 118
118 -
 119
119 -
 120
120 -
 121
121 -
 122
122 -
123
-
124
-
125
-
126
-
127
-
128
-
129
-
130
-
131
-
132
-
133
-
134
-
135
-
136
-
137
-
138
-
139
-
140
-
141
-
142
-
143
-
144
-
145
-
146
-
147
-
148
-
149
-
150
-
151
-
152
-
153
-
154
-
155
-
156
-
157
-
158
-
159
-
160
-
161
-
162
-
163
-
164
-
165
-
166
-
167
-
168
-
169
-
170
-
171
-
172
-
173
-
174
-
175
-
176
-
177
-
178
-
179
-
180
-
181
-
182
-
183
-
184
 |
 |

DineEquity, Inc. and Subsidiaries
Notes to the Consolidated Financial Statements (Continued)
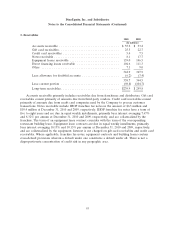
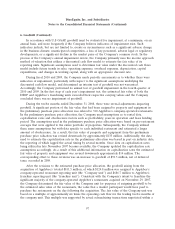
5. Property and Equipment
Property and equipment by category is as follows:
2010 2009
(In millions)
Land............................................ $136.3 $ 170.3
Buildings and improvements ........................... 311.4 395.9
Leaseholds and improvements ......................... 256.6 269.9
Equipment and fixtures .............................. 106.2 114.9
Construction in progress .............................. 6.2 9.4
Properties under capital lease obligations ................. 62.4 60.1
879.1 1,020.5
Less accumulated depreciation and amortization ............ (266.9) (249.1)
Property and equipment, net .......................... $612.2 $ 771.4
The Company recorded depreciation expense on property and equipment of $48.1 million,
$51.9 million and $58.9 million for the years ended December 31, 2010, 2009 and 2008, respectively.
Accumulated depreciation and amortization includes accumulated amortization for properties
under capital lease obligations in the amount of $27.4 million and $24.6 million at December 31, 2010
and 2009, respectively.
The Company records capitalized interest in connection with the development of new restaurants
and amortizes it over the estimated useful life of the related asset. Capitalized interest, net of
amortization, was $364,000 and $413,000 at December 31, 2010 and 2009, respectively
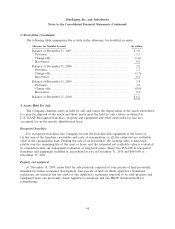
6. Goodwill
The significant majority of the Company’s goodwill and other intangible assets arose from the
November 29, 2007 acquisition of Applebee’s. The following table summarizes changes in the carrying
value of goodwill:
Reporting Unit
IHOP Applebee’s Applebee’s
Franchise Franchise Company Total
(In millions)
Balance, December 31, 2007 ........... $10.8 $537.6 $ 182.3 $ 730.7
Purchase price adjustments ............ — 149.1 (57.5) 91.6
Refranchising ..................... — — (11.3) (11.3)
Annual impairment test .............. — — (113.5) (113.5)
Balance, December 31, 2008 ........... 10.8 686.7 — 697.5
Annual impairment test .............. — — — —
Balance, December 31, 2009 ........... 10.8 686.7 — 697.5
Annual impairment test .............. — — — —
Balance, December 31, 2010 ........... $10.8 $686.7 $ — $ 697.5
96