IHOP 2010 Annual Report Download - page 58
Download and view the complete annual report
Please find page 58 of the 2010 IHOP annual report below. You can navigate through the pages in the report by either clicking on the pages listed below, or by using the keyword search tool below to find specific information within the annual report.-
 1
1 -
2
-
3
-
4
-
5
-
6
-
7
-
8
-
9
-
10
-
11
-
12
-
13
-
14
-
15
-
16
-
17
-
18
-
19
-
20
-
21
-
22
-
23
-
24
-
25
-
26
-
27
-
28
-
29
-
30
-
31
-
32
-
33
-
34
-
35
-
36
-
37
-
38
-
39
-
40
-
41
-
42
-
43
-
44
-
45
-
46
-
47
-
 48
48 -
 49
49 -
 50
50 -
 51
51 -
 52
52 -
 53
53 -
 54
54 -
 55
55 -
 56
56 -
 57
57 -
 58
58 -
 59
59 -
 60
60 -
 61
61 -
 62
62 -
 63
63 -
 64
64 -
 65
65 -
 66
66 -
 67
67 -
 68
68 -
69
-
70
-
71
-
72
-
73
-
74
-
75
-
76
-
77
-
78
-
79
-
80
-
81
-
82
-
83
-
84
-
85
-
86
-
87
-
88
-
89
-
90
-
91
-
92
-
93
-
94
-
95
-
96
-
97
-
98
-
99
-
100
-
101
-
102
-
103
-
104
-
105
-
106
-
107
-
108
-
109
-
110
-
111
-
112
-
113
-
114
-
115
-
116
-
117
-
118
-
119
-
120
-
121
-
122
-
123
-
124
-
125
-
126
-
127
-
128
-
129
-
130
-
131
-
132
-
133
-
134
-
135
-
136
-
137
-
138
-
139
-
140
-
141
-
142
-
143
-
144
-
145
-
146
-
147
-
148
-
149
-
150
-
151
-
152
-
153
-
154
-
155
-
156
-
157
-
158
-
159
-
160
-
161
-
162
-
163
-
164
-
165
-
166
-
167
-
168
-
169
-
170
-
171
-
172
-
173
-
174
-
175
-
176
-
177
-
178
-
179
-
180
-
181
-
182
-
183
-
184
 |
 |

(f) Sales percentage change and same-restaurant sales percentage change for IHOP company-operated
restaurants are not meaningful (‘‘n.m.’’) due to the relatively small number and test-market nature
of the restaurants, along with the periodic inclusion of restaurants reacquired from franchisees that
are temporarily operated by the Company.
(g) The sales percentage change for Applebee’s franchise and company-operated restaurants is
impacted by the franchising of 83 company-operated restaurants during 2010, seven company-
operated restaurants during 2009 and 103 company-operated restaurants during 2008.
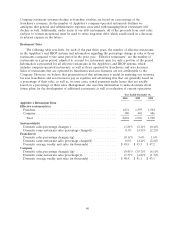
The following tables summarize Applebee’s and IHOP restaurant development and franchising
activity. Applebee’s information for 2007 is comprised of data from the 11-month period prior to the
November 29, 2007 acquisition date and one month of Applebee’s data subsequent to the acquisition
date (‘‘Pro Forma 2007’’), with 2006 information representing data derived from Applebee’s prior to
the acquisition date (‘‘Predecessor Applebee’s’’).
Year Ended December 31,
2010 2009 2008 2007 2006
(Pro forma) (1)
Applebee’s Restaurant Development Activity
Total restaurants, beginning of year .................. 2,008 2,004 1,976 1,930 1,804
New openings
Company-developed .......................... — — 1 14 35
Franchisee-developed ......................... 27 33 48 66 108
Total new openings ......................... 27 33 49 80 143
Closings
Company .................................. (7) — (3) (24) (4)
Franchise .................................. (18) (29) (18) (10) (13)
Total closings ............................. (25) (29) (21) (34) (17)
Total restaurants, end of year ...................... 2,010 2,008 2,004 1,976 1,930
Summary—end of year
Franchise ................................... 1,701 1,609 1,598 1,465 1,409
Company ................................... 309 399 406 511 521
Total ................................... 2,010 2,008 2,004 1,976 1,930
Applebee’s Franchise Restaurant Activity
Domestic franchisee-developed ..................... 14 18 28 44 90
International franchisee-developed ................... 13 15 20 22 18
Refranchised .................................. 83 7 103 — —
Total restaurants franchised ................... 110 40 151 66 108
Closings
Domestic franchise ............................ (14) (25) (15) (10) (12)
International franchise .......................... (4) (4) (3) — (1)
Total franchise closings .................... (18) (29) (18) (10) (13)
Reacquired by the Company .......................——— — (4)
Net franchise restaurant additions ................. 92 11 133 56 91
(1) Predecessor Applebee’s
42