IHOP 2010 Annual Report Download - page 54
Download and view the complete annual report
Please find page 54 of the 2010 IHOP annual report below. You can navigate through the pages in the report by either clicking on the pages listed below, or by using the keyword search tool below to find specific information within the annual report.-
 1
1 -
2
-
3
-
4
-
5
-
6
-
7
-
8
-
9
-
10
-
11
-
12
-
13
-
14
-
15
-
16
-
17
-
18
-
19
-
20
-
21
-
22
-
23
-
24
-
25
-
26
-
27
-
28
-
29
-
30
-
31
-
32
-
33
-
34
-
35
-
36
-
37
-
38
-
39
-
40
-
41
-
42
-
43
-
 44
44 -
 45
45 -
 46
46 -
 47
47 -
 48
48 -
 49
49 -
 50
50 -
 51
51 -
 52
52 -
 53
53 -
 54
54 -
 55
55 -
 56
56 -
 57
57 -
 58
58 -
 59
59 -
 60
60 -
 61
61 -
 62
62 -
 63
63 -
 64
64 -
65
-
66
-
67
-
68
-
69
-
70
-
71
-
72
-
73
-
74
-
75
-
76
-
77
-
78
-
79
-
80
-
81
-
82
-
83
-
84
-
85
-
86
-
87
-
88
-
89
-
90
-
91
-
92
-
93
-
94
-
95
-
96
-
97
-
98
-
99
-
100
-
101
-
102
-
103
-
104
-
105
-
106
-
107
-
108
-
109
-
110
-
111
-
112
-
113
-
114
-
115
-
116
-
117
-
118
-
119
-
120
-
121
-
122
-
123
-
124
-
125
-
126
-
127
-
128
-
129
-
130
-
131
-
132
-
133
-
134
-
135
-
136
-
137
-
138
-
139
-
140
-
141
-
142
-
143
-
144
-
145
-
146
-
147
-
148
-
149
-
150
-
151
-
152
-
153
-
154
-
155
-
156
-
157
-
158
-
159
-
160
-
161
-
162
-
163
-
164
-
165
-
166
-
167
-
168
-
169
-
170
-
171
-
172
-
173
-
174
-
175
-
176
-
177
-
178
-
179
-
180
-
181
-
182
-
183
-
184
 |
 |

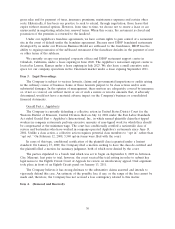
additional new restaurants committed, optioned or pending. The strong existing franchisee base
accounts for over 90% of these future obligations. In addition, we may take steps to consolidate and
rehabilitate existing markets if we believe that doing so is advisable in order to fully realize
development potential.
In a challenging economic environment and a highly competitive family dining category, there can
be no assurance that the strategies described above, when implemented, will achieve the intended
results within the time frame anticipated.
Significant Known Events, Trends or Uncertainties Impacting or Expected to Impact Comparisons of
Reported or Future Results
Refinancing of Indebtedness
In October 2010, we effected a series of transactions that culminated in the refinancing of our
remaining $1.6 billion of securitized indebtedness (the ‘‘October 2010 Refinancing’’) and the
redemption of our Series A Perpetual Preferred Stock (‘‘Series A Stock’’), both of which had been
issued to finance our 2007 acquisition of Applebee’s. The October 2010 Refinancing replaced
securitized debt that had an anticipated repayment date of 2012 with a $900 million Senior Secured
Credit Facility due in 2017 and $825 million of Senior Notes due in 2018. The redemption of the
Series A Stock eliminated high-coupon dividend payments on the Series A Stock that were not
deductible for tax purposes. In February 2011, we entered into an amendment that reduces the interest
rate pricing for borrowings under our Senior Secured Credit Facility. These transactions are discussed
in further detail under ‘‘Liquidity and Capital Resources’’ below.
Current Economic Conditions
While published economic data suggests both personal disposable income and consumer
confidence improved during 2010, we believe the countervailing effects of high levels of unemployment
and home foreclosures in addition to lower overall valuations for residential real estate will continue to
put pressure on consumer spending. A continued decline or lack of growth in disposable income for
discretionary spending could cause our customers to change historic purchasing behavior and choose
lower-cost dining options or alternatives to dining out. These factors could have an adverse effect on
our business, results of operations and financial condition.
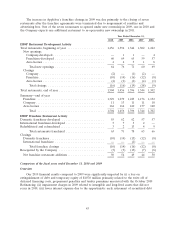
Sales Trends
Domestic Same-Restaurant Percentage Sales Change
2009 2010
Q1 Q2 Q3 Q4 Q1 Q2 Q3 Q4
Applebee’s
Quarter ............. (3.0)% (4.3)% (6.5)% (4.5)% (2.7)% (1.6)% 3.3% 2.9%
YTD............... (3.0)% (3.6)% (4.5)% (4.5)% (2.7)% (2.2)% (0.5)% 0.3%
IHOP
Quarter ............. 2.0% (0.6)% (1.1)% (3.1)% (0.4)% (1.0)% 0.1% 1.1%
YTD............... 2.0% 0.7% 0.2% (0.8)% (0.4)% (0.7)% (0.4)% 0.0%
Applebee’s domestic system-wide same-restaurant sales increased 2.9% and 0.3% for the fourth
quarter and year ended December 31, 2010, respectively. This marked the first year of positive
same-restaurant sales subsequent to the November 2007 acquisition of Applebee’s. Further, this was the
fifth consecutive quarter in which either the decline in same-restaurant sales was less than the decline
in the preceding quarter or, as was the case in the third and fourth quarters of 2010, reflected an
increase in same-restaurant sales. In light of the potential impact of economic uncertainties on
discretionary consumer spending, there can be no assurance that the trend of improvement and overall
positive performance will continue.
38