IHOP 2010 Annual Report Download - page 155
Download and view the complete annual report
Please find page 155 of the 2010 IHOP annual report below. You can navigate through the pages in the report by either clicking on the pages listed below, or by using the keyword search tool below to find specific information within the annual report.-
 1
1 -
2
-
3
-
4
-
5
-
6
-
7
-
8
-
9
-
10
-
11
-
12
-
13
-
14
-
15
-
16
-
17
-
18
-
19
-
20
-
21
-
22
-
23
-
24
-
25
-
26
-
27
-
28
-
29
-
30
-
31
-
32
-
33
-
34
-
35
-
36
-
37
-
38
-
39
-
40
-
41
-
42
-
43
-
44
-
45
-
46
-
47
-
48
-
49
-
50
-
51
-
52
-
53
-
54
-
55
-
56
-
57
-
58
-
59
-
60
-
61
-
62
-
63
-
64
-
65
-
66
-
67
-
68
-
69
-
70
-
71
-
72
-
73
-
74
-
75
-
76
-
77
-
78
-
79
-
80
-
81
-
82
-
83
-
84
-
85
-
86
-
87
-
88
-
89
-
90
-
91
-
92
-
93
-
94
-
95
-
96
-
97
-
98
-
99
-
100
-
101
-
102
-
103
-
104
-
105
-
106
-
107
-
108
-
109
-
110
-
111
-
112
-
113
-
114
-
115
-
116
-
117
-
118
-
119
-
120
-
121
-
122
-
123
-
124
-
125
-
126
-
127
-
128
-
129
-
130
-
131
-
132
-
133
-
134
-
135
-
136
-
137
-
138
-
139
-
140
-
141
-
142
-
143
-
144
-
 145
145 -
 146
146 -
 147
147 -
 148
148 -
 149
149 -
 150
150 -
 151
151 -
 152
152 -
 153
153 -
 154
154 -
 155
155 -
 156
156 -
 157
157 -
 158
158 -
 159
159 -
 160
160 -
 161
161 -
 162
162 -
 163
163 -
 164
164 -
 165
165 -
166
-
167
-
168
-
169
-
170
-
171
-
172
-
173
-
174
-
175
-
176
-
177
-
178
-
179
-
180
-
181
-
182
-
183
-
184
 |
 |

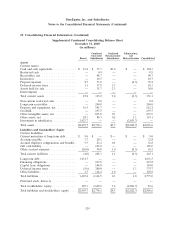
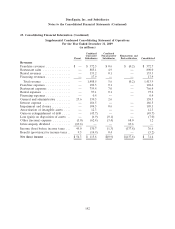
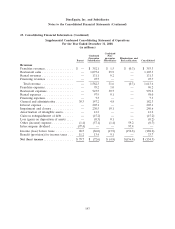
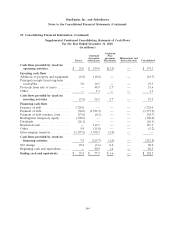
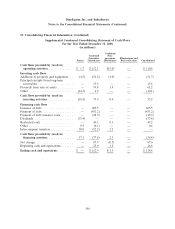
DineEquity, Inc. and Subsidiaries
Notes to the Consolidated Financial Statements (Continued)
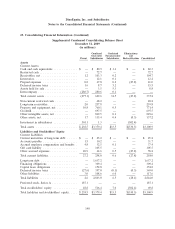
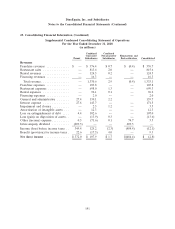
23. Consolidating Financial Information (Continued)
Supplemental Condensed Consolidating Balance Sheet
December 31, 2010
(in millions)
Combined Combined Eliminations
Guarantor Non-guarantor and
Parent Subsidiaries Subsidiaries Reclassification Consolidated
Assets
Current Assets
Cash and cash equivalents ............. $ 23.4 $ 77.3 $1.6 $ — $ 102.3
Restricted cash ..................... — 0.9 — — 0.9
Receivables, net ..................... — 98.7 — — 98.7
Inventories ........................ — 10.7 — — 10.7
Prepaid expenses .................... 2.7 73.8 — (0.3) 76.2
Deferred income taxes ................ 1.1 17.9 5.3 — 24.3
Assets held for sale .................. — 35.7 2.3 — 38.0
Intercompany ...................... — — — — —
Total current assets .................. 27.2 315.0 9.2 (0.3) 351.1
Non-current restricted cash ............. — 0.8 — — 0.8
Long-term receivables ................ — 240.0 — — 240.0
Property and equipment, net ............ 16.5 595.7 — — 612.2
Goodwill ......................... — 697.5 — — 697.5
Other intangible assets, net ............. — 835.8 0.1 — 835.9
Other assets, net .................... 28.3 89.3 0.2 1.3 119.1
Investment in subsidiaries .............. 2,023.7 — — (2,023.7) —
Total assets ........................ $2,095.7 $2,774.1 $9.5 $(2,022.7) $2,856.6
Liabilities and Stockholders’ Equity
Current Liabilities
Current maturities of long-term debt ...... $ 9.0 $ — $— $ — $ 9.0
Accounts payable .................... 3.7 29.1 — — 32.8
Accrued employee compensation and benefits . 9.3 23.4 0.1 — 32.8
Gift card liability .................... — 125.0 — — 125.0
Other accrued expenses ............... (26.0) 90.8 1.0 (0.3) 65.5
Total current liabilities ................ (4.0) 268.3 1.1 (0.3) 265.1
Long-term debt ..................... 1,631.5 — — — 1,631.5
Financing obligations ................. — 237.8 — — 237.8
Capital lease obligations ............... — 144.0 — — 144.0
Deferred income taxes ................ (5.6) 380.0 — 1.3 375.7
Other liabilities ..................... 3.5 114.4 1.0 — 118.9
Total liabilities ...................... 1,625.4 1,144.5 2.1 1.0 2,773.0
Preferred stock, Series A .............. — — — — —
Total stockholders’ equity .............. 470.3 1,629.6 7.4 (2,023.7) 83.6
Total liabilities and stockholders’ equity .... $2,095.7 $2,774.1 $9.5 $(2,022.7) $2,856.6
139