IHOP 2010 Annual Report Download - page 56
Download and view the complete annual report
Please find page 56 of the 2010 IHOP annual report below. You can navigate through the pages in the report by either clicking on the pages listed below, or by using the keyword search tool below to find specific information within the annual report.
Company restaurant revenues decline as franchise royalties are based on a percentage of the
franchisee’s revenues. As the number of Applebee’s company-operated restaurants declines we
anticipate that general and administrative expenses associated with managing these restaurants will
decline as well. Additionally, under terms of our debt instruments, all of the proceeds from asset sales
(subject to certain exceptions) must be used to retire long-term debt, which would result in a decrease
in interest expense in the future.
Restaurant Data
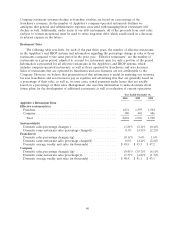
The following table sets forth, for each of the past three years, the number of effective restaurants
in the Applebee’s and IHOP systems and information regarding the percentage change in sales at those
restaurants compared to the same period in the prior year. ‘‘Effective restaurants’’ are the number of
restaurants in a given period, adjusted to account for restaurants open for only a portion of the period.
Information is presented for all effective restaurants in the Applebee’s and IHOP systems, which
includes company-operated restaurants, as well as those operated by franchisees and area licensees.
Sales of restaurants that are operated by franchisees and area licensees are not attributable to the
Company. However, we believe that presentation of this information is useful in analyzing our revenues
because franchisees and area licensees pay us royalties and advertising fees that are generally based on
a percentage of their sales, as well as, in some cases, rental payments under leases that are usually
based on a percentage of their sales. Management also uses this information to make decisions about
future plans for the development of additional restaurants as well as evaluation of current operations.
Year Ended December 31,
2010 2009 2008
Applebee’s Restaurant Data
Effective restaurants(a)
Franchise ............................................. 1,621 1,595 1,504
Company .............................................. 380 401 486
Total ............................................... 2,001 1,996 1,990
System-wide(b)
Domestic sales percentage change(c) .......................... (1.8)% (2.1)% (0.4)%
Domestic same-restaurant sales percentage change(d) ............. 0.3% (4.5)% (2.2)%
Franchise(e)
Domestic sales percentage change(c)(g) ....................... (0.1)% 3.6% 1.6%
Domestic same-restaurant sales percentage change(d) ............. 0.6% (4.4)% (2.4)%
Domestic average weekly unit sales (in thousands) ................ $ 45.8 $ 45.3 $ 47.2
Company
Domestic sales percentage change(c)(g) ....................... (8.4)% (19.7)% (6.1)%
Domestic same-restaurant sales percentage(d) ................... (1.3)% (4.8)% (1.3)%
Domestic average weekly unit sales (in thousands) ................ $ 40.4 $ 41.1 $ 43.1
40


