IHOP 2010 Annual Report Download - page 69
Download and view the complete annual report
Please find page 69 of the 2010 IHOP annual report below. You can navigate through the pages in the report by either clicking on the pages listed below, or by using the keyword search tool below to find specific information within the annual report.-
 1
1 -
2
-
3
-
4
-
5
-
6
-
7
-
8
-
9
-
10
-
11
-
12
-
13
-
14
-
15
-
16
-
17
-
18
-
19
-
20
-
21
-
22
-
23
-
24
-
25
-
26
-
27
-
28
-
29
-
30
-
31
-
32
-
33
-
34
-
35
-
36
-
37
-
38
-
39
-
40
-
41
-
42
-
43
-
44
-
45
-
46
-
47
-
48
-
49
-
50
-
51
-
52
-
53
-
54
-
55
-
56
-
57
-
58
-
 59
59 -
 60
60 -
 61
61 -
 62
62 -
 63
63 -
 64
64 -
 65
65 -
 66
66 -
 67
67 -
 68
68 -
 69
69 -
 70
70 -
 71
71 -
 72
72 -
 73
73 -
 74
74 -
 75
75 -
 76
76 -
 77
77 -
 78
78 -
 79
79 -
80
-
81
-
82
-
83
-
84
-
85
-
86
-
87
-
88
-
89
-
90
-
91
-
92
-
93
-
94
-
95
-
96
-
97
-
98
-
99
-
100
-
101
-
102
-
103
-
104
-
105
-
106
-
107
-
108
-
109
-
110
-
111
-
112
-
113
-
114
-
115
-
116
-
117
-
118
-
119
-
120
-
121
-
122
-
123
-
124
-
125
-
126
-
127
-
128
-
129
-
130
-
131
-
132
-
133
-
134
-
135
-
136
-
137
-
138
-
139
-
140
-
141
-
142
-
143
-
144
-
145
-
146
-
147
-
148
-
149
-
150
-
151
-
152
-
153
-
154
-
155
-
156
-
157
-
158
-
159
-
160
-
161
-
162
-
163
-
164
-
165
-
166
-
167
-
168
-
169
-
170
-
171
-
172
-
173
-
174
-
175
-
176
-
177
-
178
-
179
-
180
-
181
-
182
-
183
-
184
 |
 |

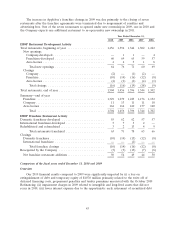
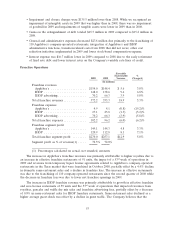
• Impairment and closure charges were $135.5 million lower than 2008. While we recognized an
impairment of intangible assets in 2009 that was higher than in 2008, there was no impairment
of goodwill in 2009 and impairments of tangible assets were lower in 2009 than in 2008.
• Gains on the extinguishment of debt totaled $45.7 million in 2009 compared to $15.2 million in
2008.
• General and administrative expenses decreased $23.8 million due primarily to the franchising of
110 Applebee’s company-operated restaurants, integration of Applebee’s and IHOP
administrative functions, transition-related costs from 2008 that did not recur, other cost
reduction initiatives implemented in 2009 and lower stock-based compensation expense.
• Interest expense was $16.7 million lower in 2009 compared to 2008 due to the early retirement
of fixed rate debt and lower interest rates on the Company’s variable rate lines of credit.
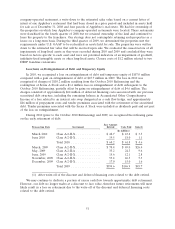
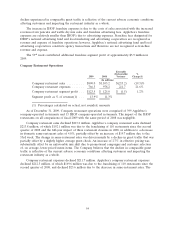
Franchise Operations
Favorable
(Unfavorable) %
2009 2008 Variance Change(1)
(In millions)
Franchise revenues
Applebee’s .................... $154.0 $148.4 $ 5.6 3.8%
IHOP ........................ 148.0 138.6 9.4 6.8%
IHOP advertising ................ 70.2 66.3 3.9 5.8%
Total franchise revenues ............. 372.2 353.3 18.9 5.3%
Franchise expenses
Applebee’s .................... 4.9 4.1 (0.8) (19.2)%
IHOP ........................ 27.1 25.8 (1.3) (5.2)%
IHOP advertising ................ 70.2 66.3 (3.9) (5.8)%
Total franchise expenses ............. 102.2 96.2 (6.0) (6.2)%
Franchise segment profit
Applebee’s .................... 149.1 144.3 4.8 3.3%
IHOP ........................ 120.9 112.8 8.1 7.1%
Total franchise segment profit ........ $270.0 $257.1 $12.9 5.0%
Segment profit as % of revenue(1) ..... 72.5% 72.8%
(1) Percentages calculated on actual, not rounded, amounts
The increase in Applebee’s franchise revenues was primarily attributable to higher royalties due to
an increase in effective franchise restaurants of 91 units, the impact of a 53rd week of operations in
2009 and revenues from temporary liquor license agreements related to Applebee’s company-operated
restaurants in the Texas market that were franchised in October 2008, partially offset by a 4.4% decline
in domestic same-restaurant sales and a decline in franchise fees. The increase in effective restaurants
was due to the franchising of 110 company-operated restaurants since the second quarter of 2008 while
the decrease in franchise fees was due to fewer net franchise openings in 2009.
The increase in IHOP franchise revenue was primarily attributable to growth in effective franchise
and area license restaurants of 59 units and the 53rd week of operations that impacted revenues from
royalties, pancake and waffle dry mix sales and franchise advertising fees, partially offset by a decrease
of 0.8% in same-restaurant sales for IHOP franchise restaurants. Same-restaurant sales declined as a
higher average guest check was offset by a decline in guest traffic. The Company believes that the
53