IHOP 2010 Annual Report Download - page 55
Download and view the complete annual report
Please find page 55 of the 2010 IHOP annual report below. You can navigate through the pages in the report by either clicking on the pages listed below, or by using the keyword search tool below to find specific information within the annual report.-
 1
1 -
2
-
3
-
4
-
5
-
6
-
7
-
8
-
9
-
10
-
11
-
12
-
13
-
14
-
15
-
16
-
17
-
18
-
19
-
20
-
21
-
22
-
23
-
24
-
25
-
26
-
27
-
28
-
29
-
30
-
31
-
32
-
33
-
34
-
35
-
36
-
37
-
38
-
39
-
40
-
41
-
42
-
43
-
44
-
 45
45 -
 46
46 -
 47
47 -
 48
48 -
 49
49 -
 50
50 -
 51
51 -
 52
52 -
 53
53 -
 54
54 -
 55
55 -
 56
56 -
 57
57 -
 58
58 -
 59
59 -
 60
60 -
 61
61 -
 62
62 -
 63
63 -
 64
64 -
 65
65 -
66
-
67
-
68
-
69
-
70
-
71
-
72
-
73
-
74
-
75
-
76
-
77
-
78
-
79
-
80
-
81
-
82
-
83
-
84
-
85
-
86
-
87
-
88
-
89
-
90
-
91
-
92
-
93
-
94
-
95
-
96
-
97
-
98
-
99
-
100
-
101
-
102
-
103
-
104
-
105
-
106
-
107
-
108
-
109
-
110
-
111
-
112
-
113
-
114
-
115
-
116
-
117
-
118
-
119
-
120
-
121
-
122
-
123
-
124
-
125
-
126
-
127
-
128
-
129
-
130
-
131
-
132
-
133
-
134
-
135
-
136
-
137
-
138
-
139
-
140
-
141
-
142
-
143
-
144
-
145
-
146
-
147
-
148
-
149
-
150
-
151
-
152
-
153
-
154
-
155
-
156
-
157
-
158
-
159
-
160
-
161
-
162
-
163
-
164
-
165
-
166
-
167
-
168
-
169
-
170
-
171
-
172
-
173
-
174
-
175
-
176
-
177
-
178
-
179
-
180
-
181
-
182
-
183
-
184
 |
 |

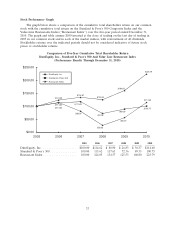
IHOP’s domestic system-wide same-restaurant sales for the year ended December 31, 2010 were
essentially flat compared with the prior year. While domestic system-wide same-restaurant sales
increased in the third and fourth quarters in contrast to decreases in the first and second quarters, we
do not believe this constitutes a discernable trend.
Fifty-Three Week Fiscal Year
Our fiscal year ends on the Sunday nearest to December 31 of each year. As a result, every five or
six years our fiscal year contains 53 calendar weeks. Fiscal 2010 and 2008 each contained 52 weeks,
whereas fiscal 2009 contained 53 weeks. The estimated impact on fiscal 2010 of the 53rd week in fiscal
2009 was an increase in 2009 revenue of $30.2 million, an increase in segment profit of $13.2 million
and an increase in income before income taxes of $10.6 million. While certain expenses increased in
direct relationship to additional revenue from the 53rd week, other costs (for example, depreciation
and other fixed costs) are recorded on a calendar month basis. Therefore, the impact of the additional
week is not necessarily indicative of a typical relationship of expenses to revenues measured over a
longer period of comparison, such as a fiscal month or a fiscal quarter.
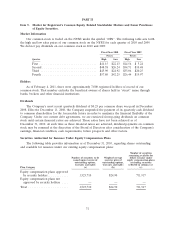
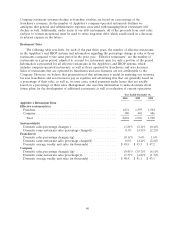
Significant Gains and Charges
There were several significant gains and charges that affect the comparisons of fiscal year 2010
results with previously reported periods, as presented in the following table:
Year ended December 31,
2010 2009 2008
(In millions)
Impairment and closure charges ................... $ 3.5 $105.1 $240.6
Loss (gain) on extinguishment of debt and temporary
equity ..................................... 107.0 (45.7) (15.2)
(Gain) loss on disposition of assets ................. (13.6) (6.9) 0.3
Each transaction is discussed in further detail under paragraphs captioned with those descriptions
elsewhere in Item 7. While impairment and closure charges in 2010 were significantly lower than in the
two previous years, our fixed and intangible assets (including goodwill) must be assessed continually for
indicators of impairment. Given the uncertainty as to future economic and other assumptions used in
assessing impairments, it is possible that significant impairment charges may occur in future periods.
Prior to the October 2010 Refinancing, our debt traded at less than its carrying value such that early
retirement by purchases on the open market resulted in significant gains. The fair value of our current
debt instruments is currently greater than its carrying value (see Note 12 of Notes to the Consolidated
Financial Statements). Therefore, while we may dedicate a portion of excess cash flow towards early
debt retirement, we do not anticipate recognizing gains on the extinguishment of debt.
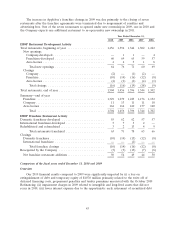
Financial Statement Effect of Franchising Company-Operated Restaurants
As of December 31, 2010, we have franchised 193 Applebee’s company-operated restaurants since
the second quarter of 2008 and have signed agreements to franchise an additional 66 restaurants. The
sale of 36 restaurants in the St. Louis market closed in January 2011 and the sale of 29 of the 30
Washington, D.C. restaurants closed in February 2011 the sale of the one remaining Washington, D.C.
restaurant is expected to close before the end of the second fiscal quarter of 2011. We are planning to
franchise a significant majority of the remaining 243 company-operated Applebee’s over the next
several years. As the number of company-operated restaurants declines, the amount of Company
restaurant revenues and Company restaurant expenses in future periods will decline significantly
compared to amounts reported in previous periods. Franchise royalty revenues and expenses will likely
increase as company-operated restaurants are franchised, although not in the same magnitude as the
39