IHOP 2010 Annual Report Download - page 93
Download and view the complete annual report
Please find page 93 of the 2010 IHOP annual report below. You can navigate through the pages in the report by either clicking on the pages listed below, or by using the keyword search tool below to find specific information within the annual report.-
 1
1 -
2
-
3
-
4
-
5
-
6
-
7
-
8
-
9
-
10
-
11
-
12
-
13
-
14
-
15
-
16
-
17
-
18
-
19
-
20
-
21
-
22
-
23
-
24
-
25
-
26
-
27
-
28
-
29
-
30
-
31
-
32
-
33
-
34
-
35
-
36
-
37
-
38
-
39
-
40
-
41
-
42
-
43
-
44
-
45
-
46
-
47
-
48
-
49
-
50
-
51
-
52
-
53
-
54
-
55
-
56
-
57
-
58
-
59
-
60
-
61
-
62
-
63
-
64
-
65
-
66
-
67
-
68
-
69
-
70
-
71
-
72
-
73
-
74
-
75
-
76
-
77
-
78
-
79
-
80
-
81
-
82
-
 83
83 -
 84
84 -
 85
85 -
 86
86 -
 87
87 -
 88
88 -
 89
89 -
 90
90 -
 91
91 -
 92
92 -
 93
93 -
 94
94 -
 95
95 -
 96
96 -
 97
97 -
 98
98 -
 99
99 -
 100
100 -
 101
101 -
 102
102 -
 103
103 -
104
-
105
-
106
-
107
-
108
-
109
-
110
-
111
-
112
-
113
-
114
-
115
-
116
-
117
-
118
-
119
-
120
-
121
-
122
-
123
-
124
-
125
-
126
-
127
-
128
-
129
-
130
-
131
-
132
-
133
-
134
-
135
-
136
-
137
-
138
-
139
-
140
-
141
-
142
-
143
-
144
-
145
-
146
-
147
-
148
-
149
-
150
-
151
-
152
-
153
-
154
-
155
-
156
-
157
-
158
-
159
-
160
-
161
-
162
-
163
-
164
-
165
-
166
-
167
-
168
-
169
-
170
-
171
-
172
-
173
-
174
-
175
-
176
-
177
-
178
-
179
-
180
-
181
-
182
-
183
-
184
 |
 |

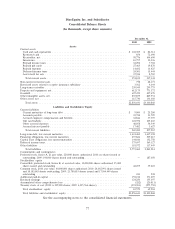
DineEquity, Inc. and Subsidiaries
Consolidated Balance Sheets
(In thousands, except share amounts)
December 31,
2010 2009
Assets
Current assets
Cash and cash equivalents ............................................. $ 102,309 $ 82,314
Restricted cash .................................................... 854 72,690
Receivables, net ................................................... 98,776 104,690
Inventories....................................................... 10,757 12,236
Prepaid income taxes ................................................ 34,094 7,702
Prepaid gift cards .................................................. 27,465 19,878
Prepaid expenses ................................................... 14,602 13,425
Deferred income taxes ............................................... 24,301 15,444
Assets held for sale ................................................. 37,944 8,765
Total current assets ................................................ 351,102 337,144
Non-current restricted cash .............................................. 778 48,173
Restricted assets related to captive insurance subsidiary ........................... 3,562 4,344
Long-term receivables ................................................. 239,945 259,775
Property and equipment, net ............................................. 612,175 771,372
Goodwill .......................................................... 697,470 697,470
Other intangible assets, net .............................................. 835,879 849,552
Other assets, net .................................................... 115,730 133,038
Total assets ..................................................... $2,856,641 $3,100,868
Liabilities and Stockholders’ Equity
Current liabilities
Current maturities of long-term debt ...................................... $ 9,000 $ 25,200
Accounts payable................................................... 32,724 31,729
Accrued employee compensation and benefits ................................ 32,846 37,397
Gift card liability ................................................... 124,972 105,465
Other accrued expenses .............................................. 48,058 54,549
Accrued interest payable .............................................. 17,482 3,627
Total current liabilities .............................................. 265,082 257,967
Long-term debt, less current maturities ...................................... 1,631,469 1,637,198
Financing obligations, less current maturities .................................. 237,826 309,415
Capital lease obligations, less current maturities ................................ 144,016 152,758
Deferred income taxes ................................................. 375,697 369,127
Other liabilities ..................................................... 118,972 117,449
Total liabilities ................................................... 2,773,062 2,843,914
Commitments and contingencies
Preferred stock, Series A, $1 par value, 220,000 shares authorized; 2010: no shares issued or
outstanding; 2009: 190,000 shares issued and outstanding ......................... — 187,050
Stockholders’ equity
Convertible preferred stock, Series B, at accreted value, 10,000,000 shares authorized; 35,000
shares issued and outstanding .......................................... 42,055 39,623
Common stock, $0.01 par value, 40,000,000 shares authorized; 2010: 24,382,991 shares issued
and 18,183,083 shares outstanding; 2009: 23,780,015 shares issued and 17,564,449 shares
outstanding ...................................................... 243 238
Additional paid-in-capital ............................................... 192,214 171,207
Retained earnings .................................................... 124,250 155,397
Accumulated other comprehensive loss ...................................... (282) (20,811)
Treasury stock, at cost (2010: 6,199,908 shares; 2009: 6,215,566 shares) ................. (274,901) (275,750)
Total stockholders’ equity ............................................. 83,579 69,904
Total liabilities and stockholders’ equity .................................... $2,856,641 $3,100,868
See the accompanying notes to the consolidated financial statements.
77