IHOP 2010 Annual Report Download - page 77
Download and view the complete annual report
Please find page 77 of the 2010 IHOP annual report below. You can navigate through the pages in the report by either clicking on the pages listed below, or by using the keyword search tool below to find specific information within the annual report.-
 1
1 -
2
-
3
-
4
-
5
-
6
-
7
-
8
-
9
-
10
-
11
-
12
-
13
-
14
-
15
-
16
-
17
-
18
-
19
-
20
-
21
-
22
-
23
-
24
-
25
-
26
-
27
-
28
-
29
-
30
-
31
-
32
-
33
-
34
-
35
-
36
-
37
-
38
-
39
-
40
-
41
-
42
-
43
-
44
-
45
-
46
-
47
-
48
-
49
-
50
-
51
-
52
-
53
-
54
-
55
-
56
-
57
-
58
-
59
-
60
-
61
-
62
-
63
-
64
-
65
-
66
-
 67
67 -
 68
68 -
 69
69 -
 70
70 -
 71
71 -
 72
72 -
 73
73 -
 74
74 -
 75
75 -
 76
76 -
 77
77 -
 78
78 -
 79
79 -
 80
80 -
 81
81 -
 82
82 -
 83
83 -
 84
84 -
 85
85 -
 86
86 -
 87
87 -
88
-
89
-
90
-
91
-
92
-
93
-
94
-
95
-
96
-
97
-
98
-
99
-
100
-
101
-
102
-
103
-
104
-
105
-
106
-
107
-
108
-
109
-
110
-
111
-
112
-
113
-
114
-
115
-
116
-
117
-
118
-
119
-
120
-
121
-
122
-
123
-
124
-
125
-
126
-
127
-
128
-
129
-
130
-
131
-
132
-
133
-
134
-
135
-
136
-
137
-
138
-
139
-
140
-
141
-
142
-
143
-
144
-
145
-
146
-
147
-
148
-
149
-
150
-
151
-
152
-
153
-
154
-
155
-
156
-
157
-
158
-
159
-
160
-
161
-
162
-
163
-
164
-
165
-
166
-
167
-
168
-
169
-
170
-
171
-
172
-
173
-
174
-
175
-
176
-
177
-
178
-
179
-
180
-
181
-
182
-
183
-
184
 |
 |

the depth and duration of the slowdown, and although Applebee’s year-to-date same-restaurant sales
were lower than the prior period, Applebee’s decline had been less than its competitors, such that the
Company believed its internal forecasts of same-restaurant sales growth were achievable; and (iv) the
Company’s net book value was in excess of its market capitalization throughout the third quarter ended
September 30, 2008, and while the market capitalization did decline below the Company’s net book
value subsequent to September 30, 2008, by the October 31, 2008 date of filing its Form 10-Q for the
Quarterly Period ending September 30, 2008, the Company’s net book value was in excess of its market
capitalization.
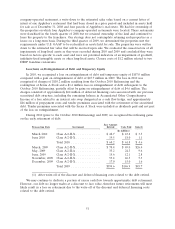
Gain on Extinguishment of Debt
During 2009 and 2008, we recognized the following gains on the early retirement of debt:
Face Amount
Transaction Date Instrument Retired Cash Paid Gain(1)
(In millions)
March, 2009 Class A-2-II-X .............. $ 78.4 $ 49.0 $26.4
May, 2009 Class A-2-II-A .............. 35.2 24.3 9.6
June, 2009 Class A-2-II-X .............. 15.6 12.1 2.8
November, 2009 Class A-2-II-X .............. 53.4 46.5 5.3
December, 2009 Class A-2-II-X .............. 17.0 15.0 1.6
Total 2009 ................. $199.6 $146.9 $45.7
August, 2008 Class A-2-II-X .............. $ 23.5 $ 20.0 $ 2.4
October, 2008 Class A-2-II-X .............. 35.2 20.0 12.8
Total 2008 ................. $ 58.7 $ 40.0 $15.2
(1) After write-off of the discount and deferred financing costs related to the debt retired.
The Company may continue to dedicate a portion of excess cash flow towards opportunistic debt
retirement. However, the difference between the face amount of debt retired and the amount we have
paid has decreased over time and it is likely that gains on future extinguishments of debt, as a
percentage of the face amount retired, will be smaller than the average gain recognized in 2008 and
2009, if they occur at all.
(Gain) Loss on Disposition of Assets
The Company recognized a gain on disposition of assets of $6.9 million in 2009, primarily related
to the franchising of seven Applebee’s restaurants in the New Mexico market and sale of a parcel of
land held by IHOP.
Other Expense (Income)
In 2009, other items of income and expense netted to an expense of $1.3 million compared to
income of $1.2 million in 2008. The primary reason for the change was lower interest income resulting
from significantly lower interest rates on United States Treasury-based investments.
Income Tax Provision (Benefit)
We recognized a tax expense of $5.2 million in 2009 as compared to a tax benefit of $33.7 million
in 2008. The change was primarily due to the increase in our pretax book income. The 2009 effective
tax rate of 14.1% applied to pretax book income was lower than the statutory Federal tax rate of 35%
primarily due to tax credits and changes in tax rates, state tax laws and unrecognized tax benefits,
partially offset by state income taxes and changes in the tax asset valuation allowance. The tax credits
are primarily FICA tip and other compensation-related tax credits associated with Applebee’s company-
owned restaurant operations and credits associated with the Applebee’s Restaurant Support Center in
Lenexa, Kansas.
61