IHOP 2010 Annual Report Download - page 106
Download and view the complete annual report
Please find page 106 of the 2010 IHOP annual report below. You can navigate through the pages in the report by either clicking on the pages listed below, or by using the keyword search tool below to find specific information within the annual report.-
 1
1 -
2
-
3
-
4
-
5
-
6
-
7
-
8
-
9
-
10
-
11
-
12
-
13
-
14
-
15
-
16
-
17
-
18
-
19
-
20
-
21
-
22
-
23
-
24
-
25
-
26
-
27
-
28
-
29
-
30
-
31
-
32
-
33
-
34
-
35
-
36
-
37
-
38
-
39
-
40
-
41
-
42
-
43
-
44
-
45
-
46
-
47
-
48
-
49
-
50
-
51
-
52
-
53
-
54
-
55
-
56
-
57
-
58
-
59
-
60
-
61
-
62
-
63
-
64
-
65
-
66
-
67
-
68
-
69
-
70
-
71
-
72
-
73
-
74
-
75
-
76
-
77
-
78
-
79
-
80
-
81
-
82
-
83
-
84
-
85
-
86
-
87
-
88
-
89
-
90
-
91
-
92
-
93
-
94
-
95
-
 96
96 -
 97
97 -
 98
98 -
 99
99 -
 100
100 -
 101
101 -
 102
102 -
 103
103 -
 104
104 -
 105
105 -
 106
106 -
 107
107 -
 108
108 -
 109
109 -
 110
110 -
 111
111 -
 112
112 -
 113
113 -
 114
114 -
 115
115 -
 116
116 -
117
-
118
-
119
-
120
-
121
-
122
-
123
-
124
-
125
-
126
-
127
-
128
-
129
-
130
-
131
-
132
-
133
-
134
-
135
-
136
-
137
-
138
-
139
-
140
-
141
-
142
-
143
-
144
-
145
-
146
-
147
-
148
-
149
-
150
-
151
-
152
-
153
-
154
-
155
-
156
-
157
-
158
-
159
-
160
-
161
-
162
-
163
-
164
-
165
-
166
-
167
-
168
-
169
-
170
-
171
-
172
-
173
-
174
-
175
-
176
-
177
-
178
-
179
-
180
-
181
-
182
-
183
-
184
 |
 |
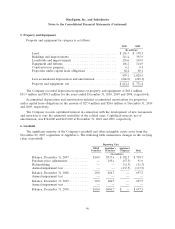
DineEquity, Inc. and Subsidiaries
Notes to the Consolidated Financial Statements (Continued)
2. Basis of Presentation and Summary of Significant Accounting Policies (Continued)
pricing model, the fair values generated by the model may not be indicative of the actual fair values of
the Company’s awards, as it does not consider other factors important to those stock-based payment
awards, such as continued employment, periodic vesting requirements and limited transferability.
The Company accounts for option grants to non-employees in accordance with U.S. GAAP,
whereby the fair value of such options is determined using the Black-Scholes option pricing model at
the earlier of the date at which the non-employee’s performance is complete or a performance
commitment is reached.
Comprehensive Income (Loss)
The Company displays comprehensive income (loss) in the Consolidated Statements of Changes in
Shareholders’ Equity, with additional disclosure regarding the components in the Notes to the
Consolidated Financial Statements. Accumulated other comprehensive loss is attributable to the
unrealized loss, net of tax, on an interest rate swap that was terminated in 2007 and a temporary
decline in the fair value of available-for-sale securities.
Net Income (Loss) Per Share
Earnings per share is calculated using the two-step method prescribed in U.S. GAAP. Basic net
income (loss) per share is computed by dividing the net income (loss) available to common
stockholders for the period by the weighted average number of common shares outstanding during the
period. Diluted net income (loss) per share is computed by dividing the net income (loss) available to
common stockholders for the period by the weighted average number of common shares and potential
shares of common stock outstanding during the period if their effect is dilutive. For the years ended
December 31, 2010, 2009 and 2008, certain dilutive shares were not included in computing the diluted
net loss per share because their effect was anti-dilutive. The Company uses the treasury stock method
to calculate the weighted average shares used in the diluted earnings per share calculation. Potentially
dilutive common shares include the assumed exercise of stock options, assumed vesting of restricted
stock units and assumed conversion of preferred stock using the if-converted method.
Business Segments
We identify our segments based on the organizational units used by management to monitor
performance and make operating decisions. Our segments are as follows: franchise operations, company
restaurant operations, rental operations and financing operations. Within these segments, as applicable,
we operate two distinct restaurant concepts: Applebee’s and IHOP.
Franchise Segment
As of December 31, 2010, the franchise operations segment consists of restaurants operated by
Applebee’s franchisees in the United States, one United States territory and 16 countries outside of the
U. S. and restaurants operated by IHOP franchisees and area licensees in the U. S., two United States
territories and two countries outside of the United States. Franchise operations revenue consists
primarily of franchise royalty revenues, sales of proprietary products (primarily IHOP pancake and
waffle dry-mixes) and the portion of the franchise fees allocated to IHOP and Applebee’s intellectual
property. Additionally, franchise fees designated for IHOP’s national advertising fund and local
marketing and advertising cooperatives are recognized as revenue and expense of franchise operations;
90