IHOP 2010 Annual Report Download - page 67
Download and view the complete annual report
Please find page 67 of the 2010 IHOP annual report below. You can navigate through the pages in the report by either clicking on the pages listed below, or by using the keyword search tool below to find specific information within the annual report.-
 1
1 -
2
-
3
-
4
-
5
-
6
-
7
-
8
-
9
-
10
-
11
-
12
-
13
-
14
-
15
-
16
-
17
-
18
-
19
-
20
-
21
-
22
-
23
-
24
-
25
-
26
-
27
-
28
-
29
-
30
-
31
-
32
-
33
-
34
-
35
-
36
-
37
-
38
-
39
-
40
-
41
-
42
-
43
-
44
-
45
-
46
-
47
-
48
-
49
-
50
-
51
-
52
-
53
-
54
-
55
-
56
-
 57
57 -
 58
58 -
 59
59 -
 60
60 -
 61
61 -
 62
62 -
 63
63 -
 64
64 -
 65
65 -
 66
66 -
 67
67 -
 68
68 -
 69
69 -
 70
70 -
 71
71 -
 72
72 -
 73
73 -
 74
74 -
 75
75 -
 76
76 -
 77
77 -
78
-
79
-
80
-
81
-
82
-
83
-
84
-
85
-
86
-
87
-
88
-
89
-
90
-
91
-
92
-
93
-
94
-
95
-
96
-
97
-
98
-
99
-
100
-
101
-
102
-
103
-
104
-
105
-
106
-
107
-
108
-
109
-
110
-
111
-
112
-
113
-
114
-
115
-
116
-
117
-
118
-
119
-
120
-
121
-
122
-
123
-
124
-
125
-
126
-
127
-
128
-
129
-
130
-
131
-
132
-
133
-
134
-
135
-
136
-
137
-
138
-
139
-
140
-
141
-
142
-
143
-
144
-
145
-
146
-
147
-
148
-
149
-
150
-
151
-
152
-
153
-
154
-
155
-
156
-
157
-
158
-
159
-
160
-
161
-
162
-
163
-
164
-
165
-
166
-
167
-
168
-
169
-
170
-
171
-
172
-
173
-
174
-
175
-
176
-
177
-
178
-
179
-
180
-
181
-
182
-
183
-
184
 |
 |

company-operated restaurant, a write-down to the estimated sales value based on a current letter of
intent of one Applebee’s restaurant that had been closed in a prior period and included in assets held
for sale as of December 31, 2008 and four parcels of Applebee’s real estate. We had fee ownership of
the properties on which four Applebee’s company-operated restaurants were located. These restaurants
were franchised in the fourth quarter of 2008 but we retained ownership of the land and continued to
lease the property to the franchisee. Our strategy does not contemplate retaining such properties as a
lessor on a long-term basis. During the third quarter of 2009, we determined the properties met the
requirements under U.S. GAAP to be reclassified as assets held for sale. The properties were written
down to the estimated fair value that will be received upon sale. We evaluated the causal factors of all
impairments of long-lived assets as they were recorded during 2010 and 2009 and concluded they were
based on factors specific to each asset and were not potential indicators of an impairment of goodwill,
indefinite-lived intangible assets or other long-lived assets. Closure costs of $1.2 million related to two
IHOP franchise restaurants.
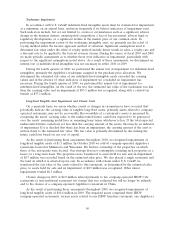
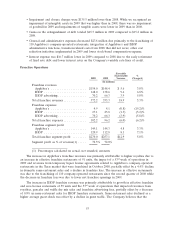
Loss/Gain on Extinguishment of Debt and Temporary Equity
In 2010, we recognized a loss on extinguishment of debt and temporary equity of $107.0 million
compared with a gain on extinguishment of debt of $45.7 million in 2009. The loss in 2010 was
comprised of charges of $110.2 million resulting from the October 2010 Refinancing and the
redemption of Series A Stock and a $1.4 million loss on extinguishment of debt subsequent to the
October 2010 Refinancing, partially offset by gains on extinguishment of debt of $4.6 million. The
charges consisted of approximately $64 million of deferred financing costs associated with our previous
securitized debt structure, including the remaining balance in Accumulated Other Comprehensive
Income of a loss related to an interest rate swap designated as a cash flow hedge, and approximately
$46 million of prepayment costs and tender premiums associated with the retirement of the securitized
debt. Tender premiums associated with the Series A Stock were included as dividends paid and not part
of the loss on extinguishment.
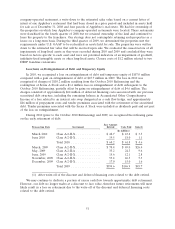
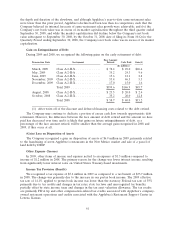
During 2010 (prior to the October 2010 Refinancing) and 2009, we recognized the following gains
on the early retirement of debt:
Face Amount
Transaction Date Instrument Retired Cash Paid Gain(1)
(In millions)
March 2010 Class A-2-II-X .............. $ 48.7 $ 43.8 $ 3.5
June 2010 Class A-2-II-X .............. 19.5 18.0 1.1
Total 2010 ................. $ 68.2 $ 61.8 $ 4.6
March, 2009 Class A-2-II-X .............. $ 78.4 $ 49.0 $26.4
May, 2009 Class A-2-II-A .............. 35.2 24.3 9.6
June, 2009 Class A-2-II-X .............. 15.6 12.1 2.8
November, 2009 Class A-2-II-X .............. 53.4 46.5 5.3
December, 2009 Class A-2-II-X .............. 17.0 15.0 1.6
Total 2009 ................. $199.6 $146.9 $45.7
(1) After write-off of the discount and deferred financing costs related to the debt retired.
We may continue to dedicate a portion of excess cash flow towards opportunistic debt retirement.
However, our debt no longer trades at a discount to face value, therefore future retirements will most
likely result in a loss on retirement due to the write-off of the discount and deferred financing costs
related to the debt retired.
51