IHOP 2010 Annual Report Download - page 59
Download and view the complete annual report
Please find page 59 of the 2010 IHOP annual report below. You can navigate through the pages in the report by either clicking on the pages listed below, or by using the keyword search tool below to find specific information within the annual report.-
 1
1 -
2
-
3
-
4
-
5
-
6
-
7
-
8
-
9
-
10
-
11
-
12
-
13
-
14
-
15
-
16
-
17
-
18
-
19
-
20
-
21
-
22
-
23
-
24
-
25
-
26
-
27
-
28
-
29
-
30
-
31
-
32
-
33
-
34
-
35
-
36
-
37
-
38
-
39
-
40
-
41
-
42
-
43
-
44
-
45
-
46
-
47
-
48
-
 49
49 -
 50
50 -
 51
51 -
 52
52 -
 53
53 -
 54
54 -
 55
55 -
 56
56 -
 57
57 -
 58
58 -
 59
59 -
 60
60 -
 61
61 -
 62
62 -
 63
63 -
 64
64 -
 65
65 -
 66
66 -
 67
67 -
 68
68 -
 69
69 -
70
-
71
-
72
-
73
-
74
-
75
-
76
-
77
-
78
-
79
-
80
-
81
-
82
-
83
-
84
-
85
-
86
-
87
-
88
-
89
-
90
-
91
-
92
-
93
-
94
-
95
-
96
-
97
-
98
-
99
-
100
-
101
-
102
-
103
-
104
-
105
-
106
-
107
-
108
-
109
-
110
-
111
-
112
-
113
-
114
-
115
-
116
-
117
-
118
-
119
-
120
-
121
-
122
-
123
-
124
-
125
-
126
-
127
-
128
-
129
-
130
-
131
-
132
-
133
-
134
-
135
-
136
-
137
-
138
-
139
-
140
-
141
-
142
-
143
-
144
-
145
-
146
-
147
-
148
-
149
-
150
-
151
-
152
-
153
-
154
-
155
-
156
-
157
-
158
-
159
-
160
-
161
-
162
-
163
-
164
-
165
-
166
-
167
-
168
-
169
-
170
-
171
-
172
-
173
-
174
-
175
-
176
-
177
-
178
-
179
-
180
-
181
-
182
-
183
-
184
 |
 |

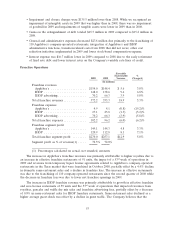
The increase in Applebee’s franchise closings in 2009 was due primarily to the closing of seven
restaurants after the franchise agreements were terminated due to nonpayment of royalties and
advertising fees. One of the seven restaurants re-opened under new ownership in 2009, one in 2010 and
the Company expects one additional restaurant to re-open under new ownership in 2011.
Year Ended December 31,
2010 2009 2008 2007 2006
IHOP Restaurant Development Activity
Total restaurants, beginning of year ..................... 1,456 1,396 1,344 1,302 1,242
New openings
Company-developed ............................. — 1 1 — 4
Franchisee-developed ............................ 60 69 65 59 57
Area license ...................................46518
Total new openings ............................ 64 76 71 60 69
Closings
Company ..................................... (2) — (1) (2) —
Franchise ..................................... (10) (14) (16) (12) (8)
Area license ................................... (4) (2) (2) (4) (1)
Total closings ................................ (16) (16) (19) (18) (9)
Total restaurants, end of year .......................... 1,504 1,456 1,396 1,344 1,302
Summary—end of year
Franchise ...................................... 1,329 1,279 1,225 1,176 1,132
Company ....................................... 11 13 11 11 10
Area license .................................... 164 164 160 157 160
Total ...................................... 1,504 1,456 1,396 1,344 1,302
IHOP Franchise Restaurant Activity
Domestic franchisee-developed ........................ 55 62 62 57 57
International franchisee-developed ......................5732—
Rehabilitated and refranchised ......................... 3 2 13 4 9
Total restaurants franchised ...................... 63 71 78 63 66
Closings
Domestic franchisee ............................... (10) (14) (15) (12) (8)
International franchisee ............................ — — (1) — —
Total franchise closings ......................... (10) (14) (16) (12) (8)
Reacquired by the Company .......................... (3) (3) (13) (7) (8)
Net franchise restaurant additions ..................... 50 54 49 44 50
Comparison of the fiscal years ended December 31, 2010 and 2009
Overview
Our 2010 financial results compared to 2009 were significantly impacted by (i) a loss on
extinguishment of debt and temporary equity of $107.0 million primarily related to the write off of
deferred financing costs, prepayment penalties and tender premiums associated with the October 2010
Refinancing; (ii) impairment charges in 2009 related to intangible and long-lived assets that did not
recur in 2010; (iii) lower interest expense due to the opportunistic early retirement of securitized debt
43