IHOP 2010 Annual Report Download - page 14
Download and view the complete annual report
Please find page 14 of the 2010 IHOP annual report below. You can navigate through the pages in the report by either clicking on the pages listed below, or by using the keyword search tool below to find specific information within the annual report.-
 1
1 -
2
-
3
-
 4
4 -
 5
5 -
 6
6 -
 7
7 -
 8
8 -
 9
9 -
 10
10 -
 11
11 -
 12
12 -
 13
13 -
 14
14 -
 15
15 -
 16
16 -
 17
17 -
 18
18 -
 19
19 -
 20
20 -
 21
21 -
 22
22 -
 23
23 -
 24
24 -
25
-
26
-
27
-
28
-
29
-
30
-
31
-
32
-
33
-
34
-
35
-
36
-
37
-
38
-
39
-
40
-
41
-
42
-
43
-
44
-
45
-
46
-
47
-
48
-
49
-
50
-
51
-
52
-
53
-
54
-
55
-
56
-
57
-
58
-
59
-
60
-
61
-
62
-
63
-
64
-
65
-
66
-
67
-
68
-
69
-
70
-
71
-
72
-
73
-
74
-
75
-
76
-
77
-
78
-
79
-
80
-
81
-
82
-
83
-
84
-
85
-
86
-
87
-
88
-
89
-
90
-
91
-
92
-
93
-
94
-
95
-
96
-
97
-
98
-
99
-
100
-
101
-
102
-
103
-
104
-
105
-
106
-
107
-
108
-
109
-
110
-
111
-
112
-
113
-
114
-
115
-
116
-
117
-
118
-
119
-
120
-
121
-
122
-
123
-
124
-
125
-
126
-
127
-
128
-
129
-
130
-
131
-
132
-
133
-
134
-
135
-
136
-
137
-
138
-
139
-
140
-
141
-
142
-
143
-
144
-
145
-
146
-
147
-
148
-
149
-
150
-
151
-
152
-
153
-
154
-
155
-
156
-
157
-
158
-
159
-
160
-
161
-
162
-
163
-
164
-
165
-
166
-
167
-
168
-
169
-
170
-
171
-
172
-
173
-
174
-
175
-
176
-
177
-
178
-
179
-
180
-
181
-
182
-
183
-
184
 |
 |

Building
momentum.
Delivering results.
results
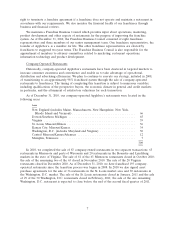
12
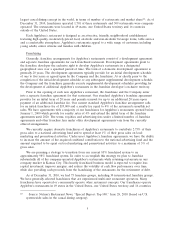
Consolidated General
& Administrative Expense
(in millions)
$158.5
$182.2
2009200820073
$193.4
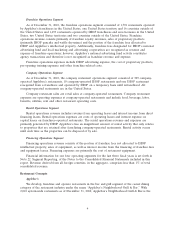
Applebee’s Company
Restaurant Operating Margins
14.4%
11.7%
20102009200820072
10.3%
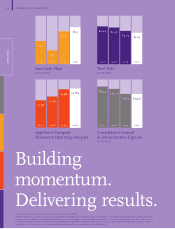
Free Cash Flow1
(in millions)
$135
$57
2010200920082007
$95
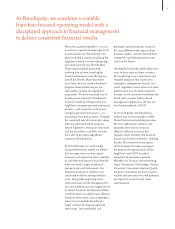
Total Debt
(in millions)
$2.14
$2.36
2010200920082007
$2.44
$153
14.8%
$2.03
$159.6
1 See non-GAAP nancial measures disclosure in the Company’s Form 10-K lings.
2 Based on Applebee’s 11-month nancial data prior to its acquisition by DineEquity on November 29, 2007, and Applebee’s one-month nancial data subsequent to the acquisition date.
3 Comprised of actual IHOP General & Administrative expense plus pro forma Applebee’s General & Administrative expense as disclosed in the Company’s 2007 Form 10-K, less certain
one-time costs primarily related to additional stock-based compensation triggered by the Applebee’s acquisition and severance costs for employees terminated in connection with the
acquisition, as well as costs related to the exploration of strategic alternatives for enhancing Applebee’s shareholder value.
2010
12 DineEquity 2010 Annual Report