IHOP 2010 Annual Report Download - page 63
Download and view the complete annual report
Please find page 63 of the 2010 IHOP annual report below. You can navigate through the pages in the report by either clicking on the pages listed below, or by using the keyword search tool below to find specific information within the annual report.-
 1
1 -
2
-
3
-
4
-
5
-
6
-
7
-
8
-
9
-
10
-
11
-
12
-
13
-
14
-
15
-
16
-
17
-
18
-
19
-
20
-
21
-
22
-
23
-
24
-
25
-
26
-
27
-
28
-
29
-
30
-
31
-
32
-
33
-
34
-
35
-
36
-
37
-
38
-
39
-
40
-
41
-
42
-
43
-
44
-
45
-
46
-
47
-
48
-
49
-
50
-
51
-
52
-
 53
53 -
 54
54 -
 55
55 -
 56
56 -
 57
57 -
 58
58 -
 59
59 -
 60
60 -
 61
61 -
 62
62 -
 63
63 -
 64
64 -
 65
65 -
 66
66 -
 67
67 -
 68
68 -
 69
69 -
 70
70 -
 71
71 -
 72
72 -
 73
73 -
74
-
75
-
76
-
77
-
78
-
79
-
80
-
81
-
82
-
83
-
84
-
85
-
86
-
87
-
88
-
89
-
90
-
91
-
92
-
93
-
94
-
95
-
96
-
97
-
98
-
99
-
100
-
101
-
102
-
103
-
104
-
105
-
106
-
107
-
108
-
109
-
110
-
111
-
112
-
113
-
114
-
115
-
116
-
117
-
118
-
119
-
120
-
121
-
122
-
123
-
124
-
125
-
126
-
127
-
128
-
129
-
130
-
131
-
132
-
133
-
134
-
135
-
136
-
137
-
138
-
139
-
140
-
141
-
142
-
143
-
144
-
145
-
146
-
147
-
148
-
149
-
150
-
151
-
152
-
153
-
154
-
155
-
156
-
157
-
158
-
159
-
160
-
161
-
162
-
163
-
164
-
165
-
166
-
167
-
168
-
169
-
170
-
171
-
172
-
173
-
174
-
175
-
176
-
177
-
178
-
179
-
180
-
181
-
182
-
183
-
184
 |
 |

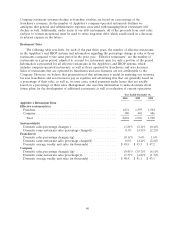
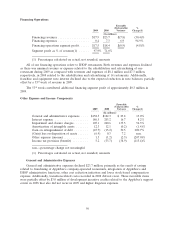
Applebee’s company restaurant operations improved to 14.8% for 2010 from 14.4% for the same
period of last year, as shown below:
Favorable
(Unfavorable)
Restaurant Expenses as Percentage of Restaurant Sales (Applebee’s) 2010 2009 Variance
Food and beverage ........................... 25.5% 26.2% 0.7%
Labor .................................... 33.2% 33.3% 0.1%
Direct and occupancy ......................... 26.6% 26.1% (0.5)%
Total Company restaurant expenses(a) ............. 85.2% 85.6% 0.4%
(a) Percentages may not add due to rounding.
Margins across all cost categories were favorably impacted 1.6% due to menu price increases and
promotional and product mix changes. Labor and direct and occupancy margins were unfavorably
affected by approximately 1.0% by the impact of guest traffic declines on fixed cost components. Other
margin changes in specific cost categories were as follows:
• Food and beverage costs as a percentage of company restaurant sales decreased 0.3% primarily
due to lower commodity cost (primarily poultry and oil) and improvement in waste reduction.
• Labor costs as a percentage of restaurant sales decreased 0.1% due to improvements in hourly
labor productivity, partially offset by higher group insurance cost.
• Direct and occupancy costs as a percentage of company restaurant sales increased 0.5% due to
increases in facility expenses for property and liability insurance and repair and maintenance,
higher national gift card program cost and credit card fees, and the 53rd week in 2009.
The 53rd week contributed additional company restaurant segment profit of approximately
$4.6 million for Applebee’s in 2009.
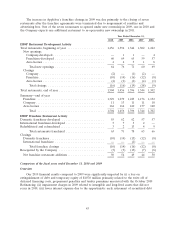
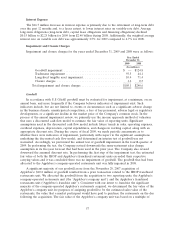
Rental Operations
Favorable
(Unfavorable) %
2010 2009 Variance Change(1)
(In millions)
Rental revenues .................. $124.5 $133.9 $(9.4) (7.0)%
Rental expenses .................. 96.1 97.3 1.2 1.2%
Rental operations segment profit ...... $ 28.4 $ 36.6 $(8.2) (22.4)%
Segment profit as % of revenue(1) ..... 22.8% 27.3%
(1) Percentages calculated on actual, not rounded, amounts
Rental operations relate primarily to IHOP restaurants. Rental income includes revenue from
operating leases and interest income from direct financing leases. Rental expenses are costs of prime
operating leases and interest expense on prime capital leases on franchisee-operated restaurants.
Rental segment profit decreased by $8.2 million. Of that decrease, $5.7 million was due to the
write-off of lease receivable cost in accordance with United States GAAP (‘‘U.S. GAAP’’) for long-term
leases, associated with 21 of the 40 franchise restaurants operated by the franchisee discussed under
Franchise Operations above. Another $2.4 million of the decrease in segment profit was due to the
53rd week of operations in 2009.
47