IHOP 2010 Annual Report Download - page 44
Download and view the complete annual report
Please find page 44 of the 2010 IHOP annual report below. You can navigate through the pages in the report by either clicking on the pages listed below, or by using the keyword search tool below to find specific information within the annual report.-
 1
1 -
2
-
3
-
4
-
5
-
6
-
7
-
8
-
9
-
10
-
11
-
12
-
13
-
14
-
15
-
16
-
17
-
18
-
19
-
20
-
21
-
22
-
23
-
24
-
25
-
26
-
27
-
28
-
29
-
30
-
31
-
32
-
33
-
 34
34 -
 35
35 -
 36
36 -
 37
37 -
 38
38 -
 39
39 -
 40
40 -
 41
41 -
 42
42 -
 43
43 -
 44
44 -
 45
45 -
 46
46 -
 47
47 -
 48
48 -
 49
49 -
 50
50 -
 51
51 -
 52
52 -
 53
53 -
 54
54 -
55
-
56
-
57
-
58
-
59
-
60
-
61
-
62
-
63
-
64
-
65
-
66
-
67
-
68
-
69
-
70
-
71
-
72
-
73
-
74
-
75
-
76
-
77
-
78
-
79
-
80
-
81
-
82
-
83
-
84
-
85
-
86
-
87
-
88
-
89
-
90
-
91
-
92
-
93
-
94
-
95
-
96
-
97
-
98
-
99
-
100
-
101
-
102
-
103
-
104
-
105
-
106
-
107
-
108
-
109
-
110
-
111
-
112
-
113
-
114
-
115
-
116
-
117
-
118
-
119
-
120
-
121
-
122
-
123
-
124
-
125
-
126
-
127
-
128
-
129
-
130
-
131
-
132
-
133
-
134
-
135
-
136
-
137
-
138
-
139
-
140
-
141
-
142
-
143
-
144
-
145
-
146
-
147
-
148
-
149
-
150
-
151
-
152
-
153
-
154
-
155
-
156
-
157
-
158
-
159
-
160
-
161
-
162
-
163
-
164
-
165
-
166
-
167
-
168
-
169
-
170
-
171
-
172
-
173
-
174
-
175
-
176
-
177
-
178
-
179
-
180
-
181
-
182
-
183
-
184
 |
 |

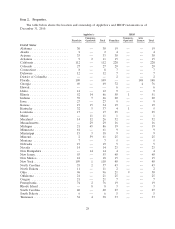
Item 2. Properties.
The table below shows the location and ownership of Applebee’s and IHOP restaurants as of
December 31, 2010:
Applebee’s IHOP
Company- Company- Area
Franchise Operated Total Franchise Operated License Total
United States
Alabama .................... 30 — 30 19 — — 19
Alaska ...................... 2 — 2 4 — — 4
Arizona ..................... 33 — 33 38 — — 38
Arkansas .................... 9 2 11 15 — — 15
California .................... 112 — 112 228 — — 228
Colorado .................... 27 — 27 29 — — 29
Connecticut .................. 8 — 8 7 — — 7
Delaware .................... 12 — 12 7 — — 7
District of Columbia ............ — — — 2 — — 2
Florida ...................... 109 — 109 — — 148 148
Georgia ..................... 69 — 69 72 — 4 76
Hawaii ...................... — — — 6 — — 6
Idaho ....................... 12 — 12 9 — — 9
Illinois ...................... 52 14 66 50 1 — 51
Indiana ..................... 59 7 66 20 — — 20
Iowa ....................... 27 — 27 9 — — 9
Kansas ...................... 19 15 34 19 — — 19
Kentucky .................... 32 5 37 4 1 — 5
Louisiana .................... 17 — 17 25 — — 25
Maine ...................... — 11 11 1 — — 1
Maryland .................... 14 12 26 32 — — 32
Massachusetts ................. — 29 29 16 — — 16
Michigan .................... 21 65 86 19 — — 19
Minnesota ................... 61 — 61 9 — — 9
Mississippi ................... 15 3 18 9 — — 9
Missouri ..................... 2 59 61 25 — — 25
Montana .................... 7 — 7 5 — — 5
Nebraska .................... 19 — 19 5 — — 5
Nevada ..................... 14 — 14 23 — — 23
New Hampshire ............... — 14 14 4 — — 4
New Jersey ................... 55 — 55 40 — — 40
New Mexico .................. 18 — 18 15 — — 15
New York .................... 109 1 110 48 — — 48
North Carolina ................ 55 2 57 43 — — 43
North Dakota ................. 11 — 11 2 — — 2
Ohio ....................... 96 — 96 21 9 — 30
Oklahoma ................... 21 — 21 25 — — 25
Oregon ..................... 21 — 21 7 — — 7
Pennsylvania .................. 74 2 76 19 — — 19
Rhode Island ................. — 8 8 3 — — 3
South Carolina ................ 40 — 40 27 — — 27
South Dakota ................. 6 — 6 5 — — 5
Tennessee .................... 34 4 38 33 — — 33
28