IHOP 2010 Annual Report Download - page 60
Download and view the complete annual report
Please find page 60 of the 2010 IHOP annual report below. You can navigate through the pages in the report by either clicking on the pages listed below, or by using the keyword search tool below to find specific information within the annual report.-
 1
1 -
2
-
3
-
4
-
5
-
6
-
7
-
8
-
9
-
10
-
11
-
12
-
13
-
14
-
15
-
16
-
17
-
18
-
19
-
20
-
21
-
22
-
23
-
24
-
25
-
26
-
27
-
28
-
29
-
30
-
31
-
32
-
33
-
34
-
35
-
36
-
37
-
38
-
39
-
40
-
41
-
42
-
43
-
44
-
45
-
46
-
47
-
48
-
49
-
 50
50 -
 51
51 -
 52
52 -
 53
53 -
 54
54 -
 55
55 -
 56
56 -
 57
57 -
 58
58 -
 59
59 -
 60
60 -
 61
61 -
 62
62 -
 63
63 -
 64
64 -
 65
65 -
 66
66 -
 67
67 -
 68
68 -
 69
69 -
 70
70 -
71
-
72
-
73
-
74
-
75
-
76
-
77
-
78
-
79
-
80
-
81
-
82
-
83
-
84
-
85
-
86
-
87
-
88
-
89
-
90
-
91
-
92
-
93
-
94
-
95
-
96
-
97
-
98
-
99
-
100
-
101
-
102
-
103
-
104
-
105
-
106
-
107
-
108
-
109
-
110
-
111
-
112
-
113
-
114
-
115
-
116
-
117
-
118
-
119
-
120
-
121
-
122
-
123
-
124
-
125
-
126
-
127
-
128
-
129
-
130
-
131
-
132
-
133
-
134
-
135
-
136
-
137
-
138
-
139
-
140
-
141
-
142
-
143
-
144
-
145
-
146
-
147
-
148
-
149
-
150
-
151
-
152
-
153
-
154
-
155
-
156
-
157
-
158
-
159
-
160
-
161
-
162
-
163
-
164
-
165
-
166
-
167
-
168
-
169
-
170
-
171
-
172
-
173
-
174
-
175
-
176
-
177
-
178
-
179
-
180
-
181
-
182
-
183
-
184
 |
 |

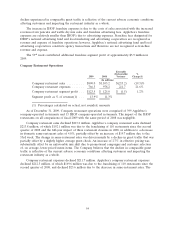
with excess cash flow prior to the October 2010 Refinancing; and (iv) a 53rd calendar week included in
fiscal 2009. In comparing the Company’s financial results for 2010 to those of 2009, we note:
• Revenues decreased $80.9 million to $1.33 billion in 2010 from $1.41 billion in 2009. The decline
was primarily due to the net effect of franchising 83 company-operated Applebee’s restaurants in
2010 and seven in 2009, a 53rd calendar week in fiscal 2009, a decline in same-restaurant sales
of (1.3%) at Applebee’s company-operated restaurants and the closure of seven Applebee’s
restaurants in 2010, partially offset by an increase in IHOP and Applebee’s effective franchise
units.
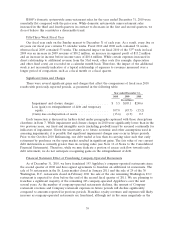
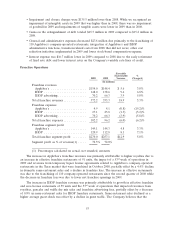
• Segment profit for 2010 decreased $15.7 million, comprised as follows:
Adjusted
Reported 2010 Less: change in
change in Impact of 2010
Segment 53rd week in Segment
Profit 2009 Profit
(in millions)
Franchise operations .................... $ 3.0 $ 5.9 $8.9
Company restaurant operations ............ (7.2) 4.6 (2.6)
Rental operations ...................... (8.2) 2.4 (5.8)
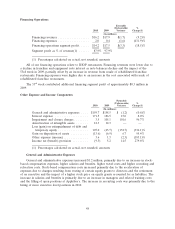
Financing operations .................... (3.3) 0.3 (3.0)
Total segment profit .................... $(15.7) $13.2 $(2.5)
The decrease in segment profit was primarily due to the impact of a 53rd calendar week in 2009,
as reflected in the table above. Additionally, segment profit was reduced by a $7.7 million charge
associated with an IHOP franchisee in default and by the net effect of franchising 90 company-
operated Applebee’s restaurants in 2010 and 2009, partially offset by an increase in IHOP
effective franchise units, margin improvements in Applebee’s company-operated restaurants and
an increase in Applebee’s same-restaurant sales.
• Impairment and closure charges were $101.6 million lower than in 2009 primarily because there
was no impairment of intangible assets in 2010.
• Loss on extinguishment of debt was $107.0 million in 2010, primarily related to the successful
October 2010 Refinancing, compared with gains on the extinguishment of debt of $45.7 million
in 2009.
• Interest expense was $15.0 million lower in 2010 compared to 2009 due to the early retirement
of fixed rate debt and lower non-cash interest charges as the result of the October 2010
Refinancing.
44