Honeywell 2012 Annual Report Download - page 96
Download and view the complete annual report
Please find page 96 of the 2012 Honeywell annual report below. You can navigate through the pages in the report by either clicking on the pages listed below, or by using the keyword search tool below to find specific information within the annual report.-
 1
1 -
2
-
3
-
4
-
5
-
6
-
7
-
8
-
9
-
10
-
11
-
12
-
13
-
14
-
15
-
16
-
17
-
18
-
19
-
20
-
21
-
22
-
23
-
24
-
25
-
26
-
27
-
28
-
29
-
30
-
31
-
32
-
33
-
34
-
35
-
36
-
37
-
38
-
39
-
40
-
41
-
42
-
43
-
44
-
45
-
46
-
47
-
48
-
49
-
50
-
51
-
52
-
53
-
54
-
55
-
56
-
57
-
58
-
59
-
60
-
61
-
62
-
63
-
64
-
65
-
66
-
67
-
68
-
69
-
70
-
71
-
72
-
73
-
74
-
75
-
76
-
77
-
78
-
79
-
80
-
81
-
82
-
83
-
84
-
85
-
 86
86 -
 87
87 -
 88
88 -
 89
89 -
 90
90 -
 91
91 -
 92
92 -
 93
93 -
 94
94 -
 95
95 -
 96
96 -
 97
97 -
 98
98 -
 99
99 -
 100
100 -
 101
101 -
 102
102 -
 103
103 -
 104
104 -
 105
105 -
 106
106 -
107
-
108
-
109
-
110
-
111
-
112
-
113
-
114
-
115
-
116
-
117
-
118
-
119
-
120
-
121
-
122
-
123
-
124
-
125
-
126
-
127
-
128
-
129
-
130
-
131
-
132
-
133
-
134
-
135
-
136
-
137
-
138
-
139
-
140
-
141
 |
 |

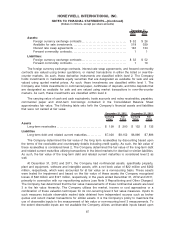
2012 2011
December 31,
Assets:
Foreign currency exchange contracts . . . . . . . . . . . . . . . . . . . . . . . . . . . . . . . . . $ 52 $ 26
Available for sale investments. . . . . . . . . . . . . . . . . . . . . . . . . . . . . . . . . . . . . . . . 518 359
Interest rate swap agreements . . . . . . . . . . . . . . . . . . . . . . . . . . . . . . . . . . . . . . . 146 134
Forward commodity contracts . . . . . . . . . . . . . . . . . . . . . . . . . . . . . . . . . . . . . . . . 1 1
Liabilities:
Foreign currency exchange contracts . . . . . . . . . . . . . . . . . . . . . . . . . . . . . . . . . $ 32 $ 52
Forward commodity contracts . . . . . . . . . . . . . . . . . . . . . . . . . . . . . . . . . . . . . . . . 1 10
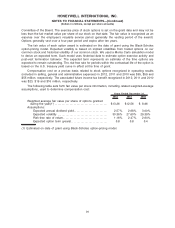
The foreign currency exchange contracts, interest rate swap agreements, and forward commodity
contracts are valued using broker quotations, or market transactions in either the listed or over-the-
counter markets. As such, these derivative instruments are classified within level 2. The Company
holds investments in marketable equity securities that are designated as available for sale and are
valued using quoted market prices. As such, these investments are classified within level 1. The
Company also holds investments in commercial paper, certificates of deposits, and time deposits that
are designated as available for sale and are valued using market transactions in over-the-counter
markets. As such, these investments are classified within level 2.
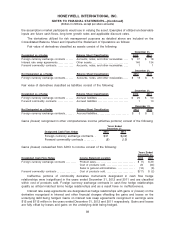
The carrying value of cash and cash equivalents, trade accounts and notes receivables, payables,
commercial paper and short-term borrowings contained in the Consolidated Balance Sheet
approximates fair value. The following table sets forth the Company’s financial assets and liabilities
that were not carried at fair value:
Carrying
Value
Fair
Value
Carrying
Value
Fair
Value
December 31, 2012 December 31, 2011
Assets
Long-term receivables . . . . . . . . . . . . . . . . . . . . . . . . . . . . . . . . . $ 199 $ 200 $ 132 $ 132
Liabilities
Long-term debt and related current maturities. . . . . . . . . . . $7,020 $8,152 $6,896 $7,896
The Company determined the fair value of the long term receivables by discounting based upon
the terms of the receivable and counterparty details including credit quality. As such, the fair value of
these receivables is considered level 2. The Company determined the fair value of the long-term debt
and related current maturities utilizing transactions in the listed markets for identical or similar liabilities.
As such, the fair value of the long-term debt and related current maturities is considered level 2 as
well.
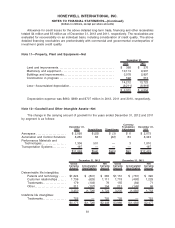
At December 31, 2012 and 2011, the Company had nonfinancial assets, specifically property,
plant and equipment, software and intangible assets, with a net book value of $22 million and $262
million, respectively, which were accounted for at fair value on a nonrecurring basis. These assets
were tested for impairment and based on the fair value of these assets the Company recognized
losses of $22 million and $127 million, respectively, in the years ended December 31, 2012 and 2011,
primarily in connection with our repositioning actions (see Note 3 Repositioning and Other Charges).
The Company has determined that the fair value measurements of these nonfinancial assets are level
3 in the fair value hierarchy. The Company utilizes the market, income or cost approaches or a
combination of these valuation techniques for its non-recurring level 3 fair value measures. Inputs to
such measures include observable market data obtained from independent sources such as broker
quotes and recent market transactions for similar assets. It is the Company’s policy to maximize the
use of observable inputs in the measurement of fair value or non-recurring level 3 measurements. To
the extent observable inputs are not available the Company utilizes unobservable inputs based upon
87
HONEYWELL INTERNATIONAL INC.
NOTES TO FINANCIAL STATEMENTS—(Continued)
(Dollars in millions, except per share amounts)