Honeywell 2012 Annual Report Download - page 124
Download and view the complete annual report
Please find page 124 of the 2012 Honeywell annual report below. You can navigate through the pages in the report by either clicking on the pages listed below, or by using the keyword search tool below to find specific information within the annual report.-
 1
1 -
2
-
3
-
4
-
5
-
6
-
7
-
8
-
9
-
10
-
11
-
12
-
13
-
14
-
15
-
16
-
17
-
18
-
19
-
20
-
21
-
22
-
23
-
24
-
25
-
26
-
27
-
28
-
29
-
30
-
31
-
32
-
33
-
34
-
35
-
36
-
37
-
38
-
39
-
40
-
41
-
42
-
43
-
44
-
45
-
46
-
47
-
48
-
49
-
50
-
51
-
52
-
53
-
54
-
55
-
56
-
57
-
58
-
59
-
60
-
61
-
62
-
63
-
64
-
65
-
66
-
67
-
68
-
69
-
70
-
71
-
72
-
73
-
74
-
75
-
76
-
77
-
78
-
79
-
80
-
81
-
82
-
83
-
84
-
85
-
86
-
87
-
88
-
89
-
90
-
91
-
92
-
93
-
94
-
95
-
96
-
97
-
98
-
99
-
100
-
101
-
102
-
103
-
104
-
105
-
106
-
107
-
108
-
109
-
110
-
111
-
112
-
113
-
 114
114 -
 115
115 -
 116
116 -
 117
117 -
 118
118 -
 119
119 -
 120
120 -
 121
121 -
 122
122 -
 123
123 -
 124
124 -
 125
125 -
 126
126 -
 127
127 -
 128
128 -
 129
129 -
 130
130 -
 131
131 -
 132
132 -
 133
133 -
 134
134 -
135
-
136
-
137
-
138
-
139
-
140
-
141
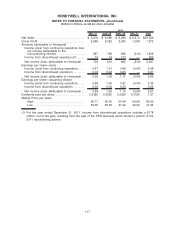
 |
 |

2012 2011 2010
December 31,
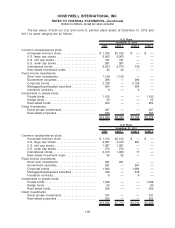
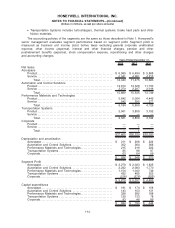
Total Assets
Aerospace . . . . . . . . . . . . . . . . . . . . . . . . . . . . . . . . . . . . . . . . . . . . . . . . . . . . $ 8,977 $ 9,109 $ 8,604
Automation and Control Solutions . . . . . . . . . . . . . . . . . . . . . . . . . . . . . . 18,754 19,127 18,183
Performance Materials and Technologies. . . . . . . . . . . . . . . . . . . . . . . 6,396 5,402 4,938
Transportation Systems . . . . . . . . . . . . . . . . . . . . . . . . . . . . . . . . . . . . . . . 2,047 1,991 1,806
Corporate. . . . . . . . . . . . . . . . . . . . . . . . . . . . . . . . . . . . . . . . . . . . . . . . . . . . . 5,679 4,179 4,303
$41,853 $39,808 $37,834
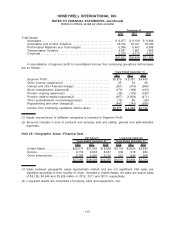
A reconciliation of segment profit to consolidated income from continuing operations before taxes
are as follows:
2012 2011 2010
Years Ended December 31,
Segment Profit. . . . . . . . . . . . . . . . . . . . . . . . . . . . . . . . . . . . . . . . . . . . . . $5,879 $ 5,357 $4,485
Other income/ (expense)(1) . . . . . . . . . . . . . . . . . . . . . . . . . . . . . . . . . 25 33 69
Interest and other financial charges . . . . . . . . . . . . . . . . . . . . . . . . . . (351) (376) (386)
Stock compensation expense(2) . . . . . . . . . . . . . . . . . . . . . . . . . . . . . (170) (168) (163)
Pension ongoing expense(2) . . . . . . . . . . . . . . . . . . . . . . . . . . . . . . . . (36) (105) (185)
Pension mark-to-market expense(2). . . . . . . . . . . . . . . . . . . . . . . . . . (957) (1,802) (471)
Other postretirement income/(expense)(2) . . . . . . . . . . . . . . . . . . . . (72) 86 (29)
Repositioning and other charges(2) . . . . . . . . . . . . . . . . . . . . . . . . . . (443) (743) (598)
Income from continuing operations before taxes . . . . . . . . . . . . . . $3,875 $ 2,282 $2,722
(1) Equity income/(loss) of affiliated companies is included in Segment Profit.
(2) Amounts included in cost of products and services sold and selling, general and administrative
expenses.
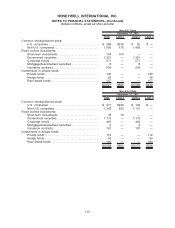
Note 25—Geographic Areas—Financial Data
Years Ended December 31, Years Ended December 31,
Net Sales(1) Long-lived Assets(2)
2012 2011 2010 2012 2011 2010
United States. . . . . . . . . . . . . . . . . . $22,379 $21,005 $18,858 $3,118 $2,956 $2,892
Europe . . . . . . . . . . . . . . . . . . . . . . . . 9,118 9,604 8,367 932 919 924
Other International . . . . . . . . . . . . . 6,168 5,920 5,125 951 929 908
$37,665 $36,529 $32,350 $5,001 $4,804 $4,724
(1) Sales between geographic areas approximate market and are not significant. Net sales are
classified according to their country of origin. Included in United States net sales are export sales
of $5,126, $4,549 and $3,629 million in 2012, 2011 and 2010, respectively.
(2) Long-lived assets are comprised of property, plant and equipment—net.
115
HONEYWELL INTERNATIONAL INC.
NOTES TO FINANCIAL STATEMENTS—(Continued)
(Dollars in millions, except per share amounts)