Honeywell 2012 Annual Report Download - page 61
Download and view the complete annual report
Please find page 61 of the 2012 Honeywell annual report below. You can navigate through the pages in the report by either clicking on the pages listed below, or by using the keyword search tool below to find specific information within the annual report.-
 1
1 -
2
-
3
-
4
-
5
-
6
-
7
-
8
-
9
-
10
-
11
-
12
-
13
-
14
-
15
-
16
-
17
-
18
-
19
-
20
-
21
-
22
-
23
-
24
-
25
-
26
-
27
-
28
-
29
-
30
-
31
-
32
-
33
-
34
-
35
-
36
-
37
-
38
-
39
-
40
-
41
-
42
-
43
-
44
-
45
-
46
-
47
-
48
-
49
-
50
-
 51
51 -
 52
52 -
 53
53 -
 54
54 -
 55
55 -
 56
56 -
 57
57 -
 58
58 -
 59
59 -
 60
60 -
 61
61 -
 62
62 -
 63
63 -
 64
64 -
 65
65 -
 66
66 -
 67
67 -
 68
68 -
 69
69 -
 70
70 -
 71
71 -
72
-
73
-
74
-
75
-
76
-
77
-
78
-
79
-
80
-
81
-
82
-
83
-
84
-
85
-
86
-
87
-
88
-
89
-
90
-
91
-
92
-
93
-
94
-
95
-
96
-
97
-
98
-
99
-
100
-
101
-
102
-
103
-
104
-
105
-
106
-
107
-
108
-
109
-
110
-
111
-
112
-
113
-
114
-
115
-
116
-
117
-
118
-
119
-
120
-
121
-
122
-
123
-
124
-
125
-
126
-
127
-
128
-
129
-
130
-
131
-
132
-
133
-
134
-
135
-
136
-
137
-
138
-
139
-
140
-
141
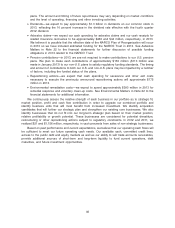
 |
 |

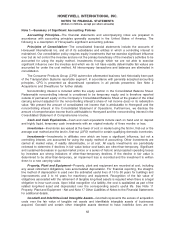
these contingencies based on an analysis of each individual issue with the assistance of outside legal
counsel and, if applicable, other experts.
In connection with the recognition of liabilities for asbestos related matters, we record asbestos
related insurance recoveries that are deemed probable. In assessing the probability of insurance
recovery, we make judgments concerning insurance coverage that we believe are reasonable and
consistent with our historical experience with our insurers, our knowledge of any pertinent solvency
issues surrounding insurers, various judicial determinations relevant to our insurance programs and our
consideration of the impacts of any settlements with our insurers. Our insurance is with both the
domestic insurance market and the London excess market. While the substantial majority of our
insurance carriers are solvent, some of our individual carriers are insolvent, which has been considered
in our analysis of probable recoveries. Projecting future events is subject to various uncertainties that
could cause the insurance recovery on asbestos related liabilities to be higher or lower than that
projected and recorded. Given the inherent uncertainty in making future projections, we reevaluate our
projections concerning our probable insurance recoveries in light of any changes to the projected
liability, our recovery experience or other relevant factors that may impact future insurance recoveries.
See Note 22 Commitments and Contingencies of Notes to the Financial Statements for a discussion of
management’s judgments applied in the recognition and measurement of insurance recoveries for
asbestos related liabilities.
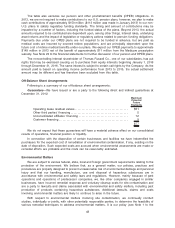
Defined Benefit Pension Plans—We sponsor both funded and unfunded U.S. and non-U.S.
defined benefit pension plans covering the majority of our employees and retirees.
We recognize net actuarial gains or losses in excess of 10 percent of the greater of the market-
related value of plan assets or the plans’ projected benefit obligation (the corridor) annually in the
fourth quarter each year (MTM Adjustment) and, if applicable, in any quarter in which an interim
remeasurement is triggered. Net actuarial gains and losses occur when the actual experience differs
from any of the various assumptions used to value our pension plans or when assumptions change as
they may each year. The primary factors contributing to actuarial gains and losses are changes in the
discount rate used to value pension obligations as of the measurement date each year and the
differences between expected and actual returns on plan assets. This accounting method also results
in the potential for volatile and difficult to forecast MTM Adjustments. MTM charges were $957, $1,802
and $471 million in 2012, 2011 and 2010, respectively. The remaining components of pension
income/expense, primarily service and interest costs and assumed return on plan assets, are recorded
on a quarterly basis (Pension Ongoing Income/Expense).
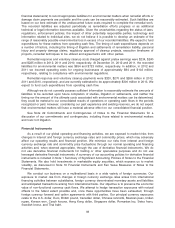
For financial reporting purposes, net periodic pension income/expense is calculated based upon a
number of actuarial assumptions, including a discount rate for plan obligations and an expected long-
term rate of return on plan assets. We determine the expected long-term rate of return on plan assets
utilizing historical plan asset returns over varying long-term periods combined with our expectations on
future market conditions and asset mix considerations (see Note 23 Pension and Other Postretirement
Benefits of Notes to the Financial Statements for details on the actual various asset classes and
targeted asset allocation percentages for our pension plans). The discount rate reflects the market rate
on December 31 (measurement date) for high-quality fixed-income investments with maturities
corresponding to our benefit obligations and is subject to change each year. Information on all our
major actuarial assumptions is included in Note 23 Pension and Other Postretirement Benefits of Notes
to the Financial Statements.
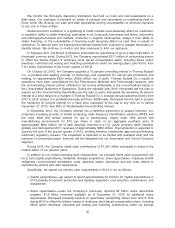
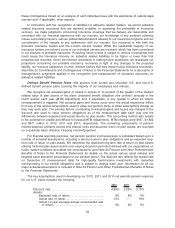
The key assumptions used in developing our 2012, 2011 and 2010 net periodic pension expense
for our U.S. plans included the following:
2012 2011 2010
Discount rate . . . . . . . . . . . . . . . . . . . . . . . . . . . . . . . . . . . . . . . 4.89% 5.25% 5.75%
Assets:
Expected rate of return. . . . . . . . . . . . . . . . . . . . . . . . . . 8% 8% 9%
Actual rate of return. . . . . . . . . . . . . . . . . . . . . . . . . . . . . 13% — 19%
Actual 10 year average annual compounded rate
of return. . . . . . . . . . . . . . . . . . . . . . . . . . . . . . . . . . . . . . 8% 6% 6%
52