Honeywell 2012 Annual Report Download - page 118
Download and view the complete annual report
Please find page 118 of the 2012 Honeywell annual report below. You can navigate through the pages in the report by either clicking on the pages listed below, or by using the keyword search tool below to find specific information within the annual report.-
 1
1 -
2
-
3
-
4
-
5
-
6
-
7
-
8
-
9
-
10
-
11
-
12
-
13
-
14
-
15
-
16
-
17
-
18
-
19
-
20
-
21
-
22
-
23
-
24
-
25
-
26
-
27
-
28
-
29
-
30
-
31
-
32
-
33
-
34
-
35
-
36
-
37
-
38
-
39
-
40
-
41
-
42
-
43
-
44
-
45
-
46
-
47
-
48
-
49
-
50
-
51
-
52
-
53
-
54
-
55
-
56
-
57
-
58
-
59
-
60
-
61
-
62
-
63
-
64
-
65
-
66
-
67
-
68
-
69
-
70
-
71
-
72
-
73
-
74
-
75
-
76
-
77
-
78
-
79
-
80
-
81
-
82
-
83
-
84
-
85
-
86
-
87
-
88
-
89
-
90
-
91
-
92
-
93
-
94
-
95
-
96
-
97
-
98
-
99
-
100
-
101
-
102
-
103
-
104
-
105
-
106
-
107
-
 108
108 -
 109
109 -
 110
110 -
 111
111 -
 112
112 -
 113
113 -
 114
114 -
 115
115 -
 116
116 -
 117
117 -
 118
118 -
 119
119 -
 120
120 -
 121
121 -
 122
122 -
 123
123 -
 124
124 -
 125
125 -
 126
126 -
 127
127 -
 128
128 -
129
-
130
-
131
-
132
-
133
-
134
-
135
-
136
-
137
-
138
-
139
-
140
-
141
 |
 |

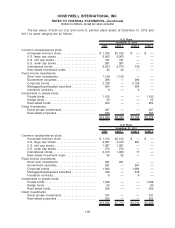
The fair values of both our U.S. and non-U.S. pension plans assets at December 31, 2012 and
2011 by asset category are as follows:
Total Level 1 Level 2 Level 3
December 31, 2012
U.S. Plans
Common stock/preferred stock:
Honeywell common stock . . . . . . . . . . . . . . . . . . . . . . . . . . $ 1,182 $1,182 $ — $ —
U.S. large cap stocks. . . . . . . . . . . . . . . . . . . . . . . . . . . . . . 2,903 2,903 — —
U.S. mid cap stocks . . . . . . . . . . . . . . . . . . . . . . . . . . . . . . . 731 731 — —
U.S. small cap stocks . . . . . . . . . . . . . . . . . . . . . . . . . . . . . 261 261 — —
International stocks. . . . . . . . . . . . . . . . . . . . . . . . . . . . . . . . 2,203 2,073 130 —
Real estate investment trusts . . . . . . . . . . . . . . . . . . . . . . 44 44 — —
Fixed income investments:
Short term investments . . . . . . . . . . . . . . . . . . . . . . . . . . . . 1,139 1,139 — —
Government securities . . . . . . . . . . . . . . . . . . . . . . . . . . . . . 266 — 266 —
Corporate bonds . . . . . . . . . . . . . . . . . . . . . . . . . . . . . . . . . . 2,728 — 2,728 —
Mortgage/Asset-backed securities . . . . . . . . . . . . . . . . . . 654 — 654 —
Insurance contracts. . . . . . . . . . . . . . . . . . . . . . . . . . . . . . . . 6 — 6 —
Investments in private funds:
Private funds. . . . . . . . . . . . . . . . . . . . . . . . . . . . . . . . . . . . . . 1,100 — — 1,100
Hedge funds . . . . . . . . . . . . . . . . . . . . . . . . . . . . . . . . . . . . . . 52 — — 52
Real estate funds . . . . . . . . . . . . . . . . . . . . . . . . . . . . . . . . . 254 — — 254
Direct investments:
Direct private investments . . . . . . . . . . . . . . . . . . . . . . . . . 227 — — 227
Real estate properties . . . . . . . . . . . . . . . . . . . . . . . . . . . . . 595 — — 595
$14,345 $8,333 $3,784 $2,228
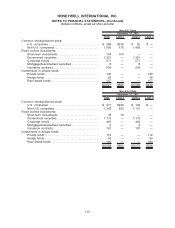
Total Level 1 Level 2 Level 3
December 31, 2011
U.S. Plans
Common stock/preferred stock:
Honeywell common stock . . . . . . . . . . . . . . . . . . . . . . . . . . $ 1,012 $1,012 $ — $ —
U.S. large cap stocks. . . . . . . . . . . . . . . . . . . . . . . . . . . . . . 2,697 2,416 281 —
U.S. mid cap stocks . . . . . . . . . . . . . . . . . . . . . . . . . . . . . . . 1,087 1,087 — —
U.S. small cap stocks . . . . . . . . . . . . . . . . . . . . . . . . . . . . . 272 272 — —
International stocks. . . . . . . . . . . . . . . . . . . . . . . . . . . . . . . . 2,010 1,993 17 —
Real estate investment trusts . . . . . . . . . . . . . . . . . . . . . . 32 32 — —
Fixed income investments:
Short term investments . . . . . . . . . . . . . . . . . . . . . . . . . . . . 941 941 — —
Government securities . . . . . . . . . . . . . . . . . . . . . . . . . . . . . 291 — 291 —
Corporate bonds . . . . . . . . . . . . . . . . . . . . . . . . . . . . . . . . . . 1,984 — 1,984 —
Mortgage/Asset-backed securities . . . . . . . . . . . . . . . . . . 435 — 435 —
Insurance contracts. . . . . . . . . . . . . . . . . . . . . . . . . . . . . . . . 6 — 6 —
Investments in private funds:
Private funds. . . . . . . . . . . . . . . . . . . . . . . . . . . . . . . . . . . . . . 1,039 — — 1,039
Hedge funds . . . . . . . . . . . . . . . . . . . . . . . . . . . . . . . . . . . . . . 60 — — 60
Real estate funds . . . . . . . . . . . . . . . . . . . . . . . . . . . . . . . . . 256 — — 256
Direct investments:
Direct private investments . . . . . . . . . . . . . . . . . . . . . . . . . 161 — — 161
Real estate properties . . . . . . . . . . . . . . . . . . . . . . . . . . . . . 553 — — 553
$12,836 $7,753 $3,014 $2,069
109
HONEYWELL INTERNATIONAL INC.
NOTES TO FINANCIAL STATEMENTS—(Continued)
(Dollars in millions, except per share amounts)