Honeywell 2012 Annual Report Download - page 122
Download and view the complete annual report
Please find page 122 of the 2012 Honeywell annual report below. You can navigate through the pages in the report by either clicking on the pages listed below, or by using the keyword search tool below to find specific information within the annual report.-
 1
1 -
2
-
3
-
4
-
5
-
6
-
7
-
8
-
9
-
10
-
11
-
12
-
13
-
14
-
15
-
16
-
17
-
18
-
19
-
20
-
21
-
22
-
23
-
24
-
25
-
26
-
27
-
28
-
29
-
30
-
31
-
32
-
33
-
34
-
35
-
36
-
37
-
38
-
39
-
40
-
41
-
42
-
43
-
44
-
45
-
46
-
47
-
48
-
49
-
50
-
51
-
52
-
53
-
54
-
55
-
56
-
57
-
58
-
59
-
60
-
61
-
62
-
63
-
64
-
65
-
66
-
67
-
68
-
69
-
70
-
71
-
72
-
73
-
74
-
75
-
76
-
77
-
78
-
79
-
80
-
81
-
82
-
83
-
84
-
85
-
86
-
87
-
88
-
89
-
90
-
91
-
92
-
93
-
94
-
95
-
96
-
97
-
98
-
99
-
100
-
101
-
102
-
103
-
104
-
105
-
106
-
107
-
108
-
109
-
110
-
111
-
 112
112 -
 113
113 -
 114
114 -
 115
115 -
 116
116 -
 117
117 -
 118
118 -
 119
119 -
 120
120 -
 121
121 -
 122
122 -
 123
123 -
 124
124 -
 125
125 -
 126
126 -
 127
127 -
 128
128 -
 129
129 -
 130
130 -
 131
131 -
 132
132 -
133
-
134
-
135
-
136
-
137
-
138
-
139
-
140
-
141
 |
 |

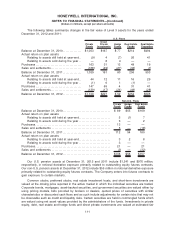
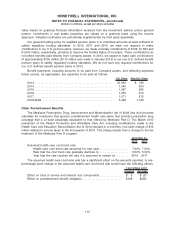
Benefit payments reflecting expected future service, as appropriate, are expected to be paid as
follows:
Without Impact of
Medicare Subsidy
Net of
Medicare Subsidy
2013 . . . . . . . . . . . . . . . . . . . . . . . . . . . . . . . . . . . . . . . . . . . . . . . . . $160 $149
2014 . . . . . . . . . . . . . . . . . . . . . . . . . . . . . . . . . . . . . . . . . . . . . . . . . 150 139
2015 . . . . . . . . . . . . . . . . . . . . . . . . . . . . . . . . . . . . . . . . . . . . . . . . . 141 131
2016 . . . . . . . . . . . . . . . . . . . . . . . . . . . . . . . . . . . . . . . . . . . . . . . . . 133 122
2017 . . . . . . . . . . . . . . . . . . . . . . . . . . . . . . . . . . . . . . . . . . . . . . . . . 124 114
2018-2022. . . . . . . . . . . . . . . . . . . . . . . . . . . . . . . . . . . . . . . . . . . . 505 456
Employee Savings Plans
We sponsor employee savings plans under which we match, in the form of our common stock,
savings plan contributions for certain eligible employees. Shares issued under the stock match plans
were 2.4, 2.6, and 2.4 million at a cost of $144, $138 and $105 million in 2012, 2011, and 2010,
respectively.
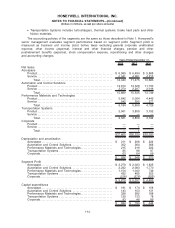
Note 24—Segment Financial Data
We globally manage our business operations through four reportable operating segments serving
customers worldwide with aerospace products and services, control, sensing and security technologies
for buildings, homes and industry, automotive products and chemicals. Segment information is
consistent with how management reviews the businesses, makes investing and resource allocation
decisions and assesses operating performance. Our four reportable segments are as follows:
•Aerospace includes Air Transport and Regional, Business and General Aviation and Defense
and Space and provides products and services which include auxiliary power units; propulsion
engines; environmental control systems; electric power systems, engine controls; repair and
overhaul services; flight safety, communications, navigation, radar and surveillance systems;
aircraft lighting; management and technical services; logistic services; advanced systems and
instruments; and aircraft wheels and brakes.
•Automation and Control Solutions includes Energy, Safety & Security (controls for heating,
cooling, indoor air quality, ventilation, humidification, lighting and home automation; advanced
software applications for home/building control and optimization; sensors, switches, control
systems and instruments for measuring pressure, air flow, temperature and electrical current;
security, fire and gas detection; personal protection equipment; access control; video
surveillance equipment; remote patient monitoring systems; and automatic identification and
data collection); Process Solutions (provides a full range of automation and control solutions for
industrial plants, offering advanced software and automation systems that integrate, control and
monitor complex processes in many types of industrial settings as well as equipment that
controls, measures and analyzes natural gas production and transportation); and Building
Solutions & Distribution (installs, distributes, maintains and upgrades systems that keep
buildings safe, comfortable and productive).
•Performance Materials and Technologies includes Advanced Materials (fluorocarbons, hydro-
fluoroolefins, caprolactam, resins, ammonium sulfate for fertilizer, specialty films, waxes,
additives, advanced fibers, customized research chemicals and intermediates, and electronic
materials and chemicals) and UOP (process technology, products, including catalysts and
absorbents, and services for the petroleum refining, gas processing, petrochemical, renewable
energy and other industries).
113
HONEYWELL INTERNATIONAL INC.
NOTES TO FINANCIAL STATEMENTS—(Continued)
(Dollars in millions, except per share amounts)