Honeywell 2012 Annual Report Download - page 4
Download and view the complete annual report
Please find page 4 of the 2012 Honeywell annual report below. You can navigate through the pages in the report by either clicking on the pages listed below, or by using the keyword search tool below to find specific information within the annual report.-
 1
1 -
 2
2 -
 3
3 -
 4
4 -
 5
5 -
 6
6 -
 7
7 -
 8
8 -
 9
9 -
 10
10 -
 11
11 -
 12
12 -
 13
13 -
 14
14 -
 15
15 -
16
-
17
-
18
-
19
-
20
-
21
-
22
-
23
-
24
-
25
-
26
-
27
-
28
-
29
-
30
-
31
-
32
-
33
-
34
-
35
-
36
-
37
-
38
-
39
-
40
-
41
-
42
-
43
-
44
-
45
-
46
-
47
-
48
-
49
-
50
-
51
-
52
-
53
-
54
-
55
-
56
-
57
-
58
-
59
-
60
-
61
-
62
-
63
-
64
-
65
-
66
-
67
-
68
-
69
-
70
-
71
-
72
-
73
-
74
-
75
-
76
-
77
-
78
-
79
-
80
-
81
-
82
-
83
-
84
-
85
-
86
-
87
-
88
-
89
-
90
-
91
-
92
-
93
-
94
-
95
-
96
-
97
-
98
-
99
-
100
-
101
-
102
-
103
-
104
-
105
-
106
-
107
-
108
-
109
-
110
-
111
-
112
-
113
-
114
-
115
-
116
-
117
-
118
-
119
-
120
-
121
-
122
-
123
-
124
-
125
-
126
-
127
-
128
-
129
-
130
-
131
-
132
-
133
-
134
-
135
-
136
-
137
-
138
-
139
-
140
-
141
 |
 |
initiatives like Honeywell Operating System (HOS), Velocity Product Development™(VPD™),
and Functional Transformation (FT). We want to be able to do everything right and fast.
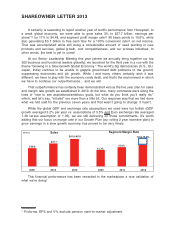
This outperformance will continue through the evolution of continually improving Internal
Processes. In a slow-growth global economy, this becomes especially important for margin
rate growth. It starts with conservative sales planning and resourcing areas of the world
where growth is stronger (our High Growth Regions focus) and extends to basic cost
management like reducing material costs, using less indirect material, and being conservative
in our census planning (through our OEF concept—Organizational Efficiency). Then our big
company-wide process initiatives keep us on an evolutionary path with constant seed
planting.
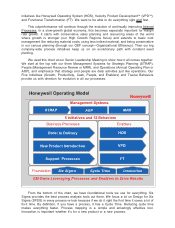
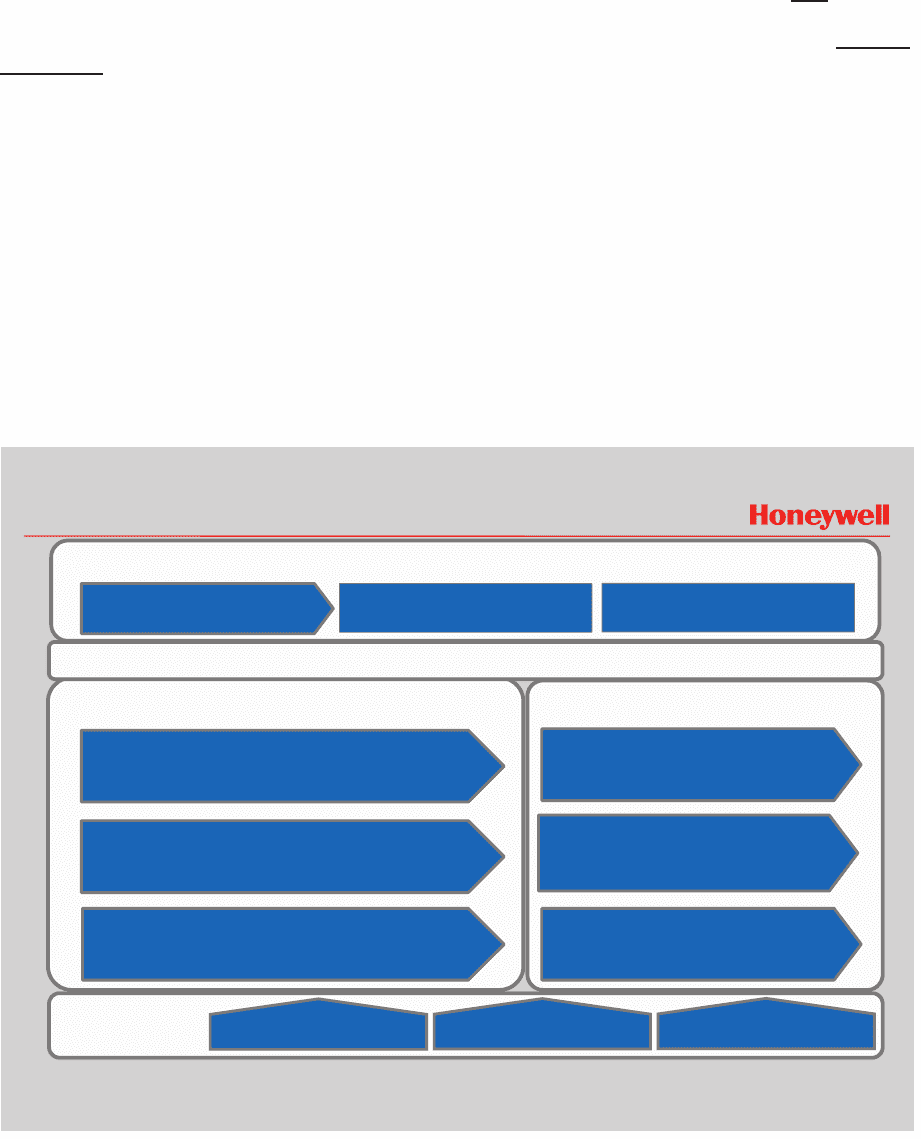
We used this chart at our Senior Leadership Meeting to show how it all comes together.
We start at the top with our three Management Systems for Strategic Planning (STRAP),
People (Management Resource Review or MRR), and Operations (Annual Operating Plan or
AOP), and emphasize that strategy and people are daily activities just like operations. Our
Five Initiatives (Growth, Productivity, Cash, People, and Enablers) and Twelve Behaviors
provide us with direction for evolution in all our processes.
HOS
VPD
FT
S
STRAP
Honeywell Operating Model
GM Owns Leveraging Processes and Enablers to Drive Results
Foundation
Business Processes
Order to Delivery
New Product Introduction
Support Processes
Six Sigm a
Management Systems
Enablers
5 Initiatives and 12 Behaviors
AOP MRR
Cycle Time Innovat ion
From the bottom of the chart, we have foundational tools we use for everything. Six
Sigma provides the best process analysis tools out there. We focus a lot on Design for Six
Sigma (DFSS) in every process re-look because if we do it right the first time it saves a lot of
fix-it time. By definition, if you have a process, it has a Cycle Time. Reducing cycle time
makes everything faster. Process mapping is a simple and amazingly effective tool.
Innovation is important whether it’s for a new product or a new process.