Honeywell 2012 Annual Report Download - page 47
Download and view the complete annual report
Please find page 47 of the 2012 Honeywell annual report below. You can navigate through the pages in the report by either clicking on the pages listed below, or by using the keyword search tool below to find specific information within the annual report.-
 1
1 -
2
-
3
-
4
-
5
-
6
-
7
-
8
-
9
-
10
-
11
-
12
-
13
-
14
-
15
-
16
-
17
-
18
-
19
-
20
-
21
-
22
-
23
-
24
-
25
-
26
-
27
-
28
-
29
-
30
-
31
-
32
-
33
-
34
-
35
-
36
-
 37
37 -
 38
38 -
 39
39 -
 40
40 -
 41
41 -
 42
42 -
 43
43 -
 44
44 -
 45
45 -
 46
46 -
 47
47 -
 48
48 -
 49
49 -
 50
50 -
 51
51 -
 52
52 -
 53
53 -
 54
54 -
 55
55 -
 56
56 -
 57
57 -
58
-
59
-
60
-
61
-
62
-
63
-
64
-
65
-
66
-
67
-
68
-
69
-
70
-
71
-
72
-
73
-
74
-
75
-
76
-
77
-
78
-
79
-
80
-
81
-
82
-
83
-
84
-
85
-
86
-
87
-
88
-
89
-
90
-
91
-
92
-
93
-
94
-
95
-
96
-
97
-
98
-
99
-
100
-
101
-
102
-
103
-
104
-
105
-
106
-
107
-
108
-
109
-
110
-
111
-
112
-
113
-
114
-
115
-
116
-
117
-
118
-
119
-
120
-
121
-
122
-
123
-
124
-
125
-
126
-
127
-
128
-
129
-
130
-
131
-
132
-
133
-
134
-
135
-
136
-
137
-
138
-
139
-
140
-
141
 |
 |

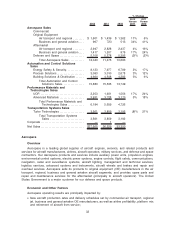
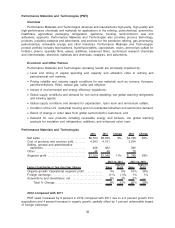
Performance Materials and Technologies (PMT)
Overview
Performance Materials and Technologies develops and manufactures high-purity, high-quality and
high-performance chemicals and materials for applications in the refining, petrochemical, automotive,
healthcare, agricultural, packaging, refrigeration, appliance, housing, semiconductor, wax and
adhesives segments. Performance Materials and Technologies also provides process technology,
products, including catalysts and adsorbents, and services for the petroleum refining, gas processing,
petrochemical, renewable energy and other industries. Performance Materials and Technologies’
product portfolio includes fluorocarbons, hydrofluoroolefins, caprolactam, resins, ammonium sulfate for
fertilizer, phenol, specialty films, waxes, additives, advanced fibers, customized research chemicals
and intermediates, electronic materials and chemicals, catalysts, and adsorbents.
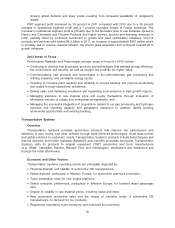
Economic and Other Factors
Performance Materials and Technologies operating results are principally impacted by:
•Level and timing of capital spending and capacity and utilization rates in refining and
petrochemical end markets;
•Pricing volatility and industry supply conditions for raw materials such as cumene, fluorspar,
perchloroethylene, R240, natural gas, sulfur and ethylene;
•Impact of environmental and energy efficiency regulations;
•Global supply conditions and demand for non-ozone depleting, low global warming refrigerants
and blowing agents;
•Global supply conditions and demand for caprolactam, nylon resin and ammonium sulfate;
•Condition of the U.S. residential housing and non-residential industries and automotive demand;
•Extent of change in order rates from global semiconductor customers; and
•Demand for new products including renewable energy and biofuels, low global warming
products for insulation and refrigeration, additives, and enhanced nylon resin.
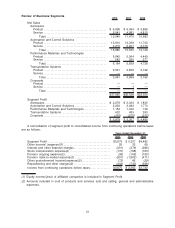
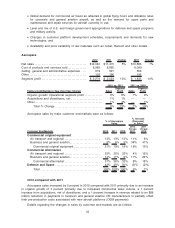
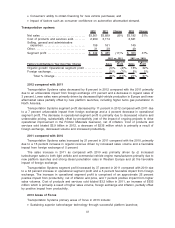
Performance Materials and Technologies
2012 2011 Change 2010 Change
Net sales . . . . . . . . . . . . . . . . . . . . . . . . . . . . . . . . . $6,184 $5,659 9% $4,726 20%
Cost of products and services sold . . . . . . . . . 4,543 4,151 3,554
Selling, general and administrative
expenses . . . . . . . . . . . . . . . . . . . . . . . . . . . . . . . 439 420 345
Other . . . . . . . . . . . . . . . . . . . . . . . . . . . . . . . . . . . . . 48 46 78
Segment profit . . . . . . . . . . . . . . . . . . . . . . . . . . . . $1,154 $1,042 11% $ 749 39%
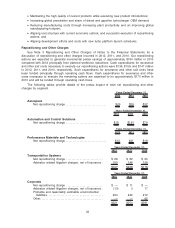
Factors Contributing to Year-Over-Year Change Sales
Segment
Profit Sales
Segment
Profit
2012 vs. 2011 2011 vs. 2010
Organic growth/ Operational segment profit . . . . . . . . . . . . . 4% 9% 16% 38%
Foreign exchange. . . . . . . . . . . . . . . . . . . . . . . . . . . . . . . . . . . . . . (1)% (1)% 1% 1%
Acquisitions and divestitures, net . . . . . . . . . . . . . . . . . . . . . . . 6% 3% 3% —
Total % Change . . . . . . . . . . . . . . . . . . . . . . . . . . . . . . . . . . . 9% 11% 20% 39%
2012 compared with 2011
PMT sales increased by 9 percent in 2012 compared with 2011 due to a 6 percent growth from
acquisitions and 4 percent increase in organic growth, partially offset by 1 percent unfavorable impact
of foreign exchange.
38