Honeywell 2012 Annual Report Download - page 37
Download and view the complete annual report
Please find page 37 of the 2012 Honeywell annual report below. You can navigate through the pages in the report by either clicking on the pages listed below, or by using the keyword search tool below to find specific information within the annual report.-
 1
1 -
2
-
3
-
4
-
5
-
6
-
7
-
8
-
9
-
10
-
11
-
12
-
13
-
14
-
15
-
16
-
17
-
18
-
19
-
20
-
21
-
22
-
23
-
24
-
25
-
26
-
 27
27 -
 28
28 -
 29
29 -
 30
30 -
 31
31 -
 32
32 -
 33
33 -
 34
34 -
 35
35 -
 36
36 -
 37
37 -
 38
38 -
 39
39 -
 40
40 -
 41
41 -
 42
42 -
 43
43 -
 44
44 -
 45
45 -
 46
46 -
 47
47 -
48
-
49
-
50
-
51
-
52
-
53
-
54
-
55
-
56
-
57
-
58
-
59
-
60
-
61
-
62
-
63
-
64
-
65
-
66
-
67
-
68
-
69
-
70
-
71
-
72
-
73
-
74
-
75
-
76
-
77
-
78
-
79
-
80
-
81
-
82
-
83
-
84
-
85
-
86
-
87
-
88
-
89
-
90
-
91
-
92
-
93
-
94
-
95
-
96
-
97
-
98
-
99
-
100
-
101
-
102
-
103
-
104
-
105
-
106
-
107
-
108
-
109
-
110
-
111
-
112
-
113
-
114
-
115
-
116
-
117
-
118
-
119
-
120
-
121
-
122
-
123
-
124
-
125
-
126
-
127
-
128
-
129
-
130
-
131
-
132
-
133
-
134
-
135
-
136
-
137
-
138
-
139
-
140
-
141
 |
 |

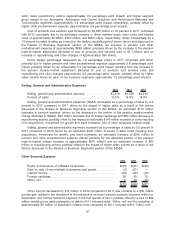
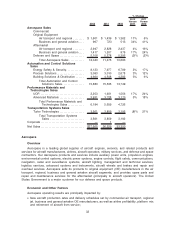
Other income decreased by $13 million in 2011 compared to 2010 due primarily to a $29 million
loss resulting from early redemption of debt in the first quarter of 2011, included within “Other, net”,
and the absence of a $62 million pre-tax gain related to the consolidation of a joint venture within our
Performance Materials and Technologies segment in the third quarter of 2010, included within “Other,
net”, (see Note 4 of Notes to Financial Statements for further details), partially offset by a $61 million
increase in gain on sale of non-strategic businesses and assets due primarily to a $50 million pre-tax
gain related to the divestiture of the automotive on-board sensors products business within our
Automation and Control Solutions segment and the reduction of approximately $12 million of
acquisition related costs compared to 2010 included within “Other, net”.
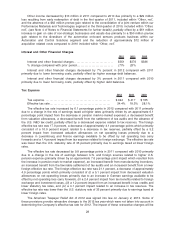
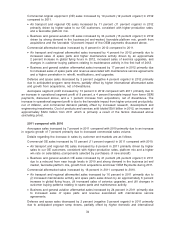
Interest and Other Financial Charges
2012 2011 2010
Interest and other financial charges. . . . . . . . . . . . . . . . . . . . . . . . . . . . . $351 $376 $386
% change compared with prior period. . . . . . . . . . . . . . . . . . . . . . . . . . . (7)% (3)%
Interest and other financial charges decreased by 7% percent in 2012 compared with 2011
primarily due to lower borrowing costs, partially offset by higher average debt balances.
Interest and other financial charges decreased by 3% percent in 2011 compared with 2010
primarily due to lower borrowing costs, partially offset by higher debt balances.
Tax Expense
2012 2011 2010
Tax expense. . . . . . . . . . . . . . . . . . . . . . . . . . . . . . . . . . . . . . . . . . . . . . . . . $ 944 $ 417 $ 765
Effective tax rate. . . . . . . . . . . . . . . . . . . . . . . . . . . . . . . . . . . . . . . . . . . . . 24.4% 18.3% 28.1%
The effective tax rate increased by 6.1 percentage points in 2012 compared with 2011 primarily
due to a change in the mix of earnings taxed at higher rates (primarily driven by an approximate 6.1
percentage point impact from the decrease in pension mark-to-market expense), a decreased benefit
from valuation allowances, a decreased benefit from the settlement of tax audits and the absence of
the U.S. R&D tax credit, partially offset by a decreased expense related to tax reserves. The foreign
effective tax rate was 17.0 percent, a decrease of approximately 4.1 percentage points which primarily
consisted of a 10.0 percent impact related to a decrease in tax reserves, partially offset by a 5.2
percent impact from increased valuation allowances on net operating losses primarily due to a
decrease in Luxembourg and France earnings available to be offset by net operating loss carry
forwards and a 1.4 percent impact from tax expense related to foreign exchange. The effective tax rate
was lower than the U.S. statutory rate of 35 percent primarily due to earnings taxed at lower foreign
rates.
The effective tax rate decreased by 9.8 percentage points in 2011 compared with 2010 primarily
due to a change in the mix of earnings between U.S. and foreign sources related to higher U.S.
pension expense (primarily driven by an approximate 7.6 percentage point impact which resulted from
the increase in pension mark-to-market expense), an increased benefit from manufacturing incentives,
an increased benefit from the favorable settlement of tax audits and an increased benefit from a lower
foreign effective tax rate. The foreign effective tax rate was 21.1 percent, a decrease of approximately
4.9 percentage points which primarily consisted of (i) a 5.1 percent impact from decreased valuation
allowances on net operating losses primarily due to an increase in German earnings available to be
offset by net operating loss carry forwards, (ii) a 2.4 percent impact from tax benefits related to foreign
exchange and investment losses, (iii) a 1.2 percent impact from an increased benefit in tax credits and
lower statutory tax rates, and (iv) a 4.1 percent impact related to an increase in tax reserves. The
effective tax rate was lower than the U.S. statutory rate of 35 percent primarily due to earnings taxed at
lower foreign rates.
The American Taxpayer Relief Act of 2012 was signed into law on January 2, 2013. Some of
these provisions provide retroactive changes to the 2012 tax year which were not taken into account in
determining the Company’s effective tax rate for 2012. The impact of these retroactive changes will be
28