Honeywell 2012 Annual Report Download - page 6
Download and view the complete annual report
Please find page 6 of the 2012 Honeywell annual report below. You can navigate through the pages in the report by either clicking on the pages listed below, or by using the keyword search tool below to find specific information within the annual report.-
 1
1 -
 2
2 -
 3
3 -
 4
4 -
 5
5 -
 6
6 -
 7
7 -
 8
8 -
 9
9 -
 10
10 -
 11
11 -
 12
12 -
 13
13 -
 14
14 -
 15
15 -
 16
16 -
 17
17 -
18
-
19
-
20
-
21
-
22
-
23
-
24
-
25
-
26
-
27
-
28
-
29
-
30
-
31
-
32
-
33
-
34
-
35
-
36
-
37
-
38
-
39
-
40
-
41
-
42
-
43
-
44
-
45
-
46
-
47
-
48
-
49
-
50
-
51
-
52
-
53
-
54
-
55
-
56
-
57
-
58
-
59
-
60
-
61
-
62
-
63
-
64
-
65
-
66
-
67
-
68
-
69
-
70
-
71
-
72
-
73
-
74
-
75
-
76
-
77
-
78
-
79
-
80
-
81
-
82
-
83
-
84
-
85
-
86
-
87
-
88
-
89
-
90
-
91
-
92
-
93
-
94
-
95
-
96
-
97
-
98
-
99
-
100
-
101
-
102
-
103
-
104
-
105
-
106
-
107
-
108
-
109
-
110
-
111
-
112
-
113
-
114
-
115
-
116
-
117
-
118
-
119
-
120
-
121
-
122
-
123
-
124
-
125
-
126
-
127
-
128
-
129
-
130
-
131
-
132
-
133
-
134
-
135
-
136
-
137
-
138
-
139
-
140
-
141
 |
 |

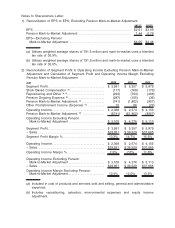
Notes to Shareowners Letter:
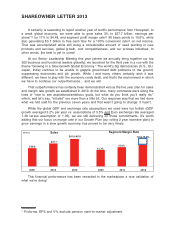
1) Reconciliation of EPS to EPS, Excluding Pension Mark-to-Market Adjustment
2011(a) 2012(b)
EPS. ................................................................. $2.61 $3.69
Pension Mark-to-Market Adjustment . . . ................................ 1.44 0.79
EPS—Excluding Pension
Mark-to-Market Adjustment . . . ....................................... $4.05 $4.48
(a) Utilizes weighted average shares of 791.6 million and mark-to-market uses a blended
tax rate of 36.9%.
(b) Utilizes weighted average shares of 791.9 million and mark-to-market uses a blended
tax rate of 35.0%.
2) Reconciliation of Segment Profit to Operating Income Excluding Pension Mark-to-Market
Adjustment and Calculation of Segment Profit and Operating Income Margin Excluding
Pension Mark-to-Market Adjustment
($M) 2009 2011 2012
Segment Profit . ..................................... $ 3,991 $ 5,357 $ 5,879
Stock Based Compensation (a) ....................... (117) (168) (170)
Repositioning and Other (a, b)......................... (493) (794) (488)
Pension Ongoing Expense (a) ........................ (287) (105) (36)
Pension Mark-to-Market Adjustment (a) ............... (741) (1,802) (957)
Other Postretirement Income (Expense) (a) ........... 15 86 (72)
Operating Income ................................... $ 2,368 $ 2,574 $ 4,156
Pension Mark-to-Market Adjustment (a) ............... ($741) ($1,802) ($957)
Operating Income Excluding Pension
Mark-to-Market Adjustment . ....................... $ 3,109 $ 4,376 $ 5,113
Segment Profit . ..................................... $ 3,991 $ 5,357 $ 5,879
÷Sales ............................................. $29,951 $ 36,529 $37,665
Segment Profit Margin % ............................ 13.3% 14.7% 15.6%
Operating Income ................................... $ 2,368 $ 2,574 $ 4,156
÷Sales ............................................. $29,951 $ 36,529 $37,665
Operating Income Margin % . . ....................... 7.9% 7.0% 11.0%
Operating Income Excluding Pension
Mark-to-Market Adjustment . ....................... $ 3,109 $ 4,376 $ 5,113
÷Sales ............................................. $29,951 $ 36,529 $37,665
Operating Income Margin Excluding Pension
Mark-to-Market Adjustment . ....................... 10.4% 12.0% 13.6%
(a) Included in cost of products and services sold and selling, general and administrative
expenses.
(b) Includes repositioning, asbestos, environmental expenses and equity income
adjustment.