Honeywell 2012 Annual Report Download - page 115
Download and view the complete annual report
Please find page 115 of the 2012 Honeywell annual report below. You can navigate through the pages in the report by either clicking on the pages listed below, or by using the keyword search tool below to find specific information within the annual report.-
 1
1 -
2
-
3
-
4
-
5
-
6
-
7
-
8
-
9
-
10
-
11
-
12
-
13
-
14
-
15
-
16
-
17
-
18
-
19
-
20
-
21
-
22
-
23
-
24
-
25
-
26
-
27
-
28
-
29
-
30
-
31
-
32
-
33
-
34
-
35
-
36
-
37
-
38
-
39
-
40
-
41
-
42
-
43
-
44
-
45
-
46
-
47
-
48
-
49
-
50
-
51
-
52
-
53
-
54
-
55
-
56
-
57
-
58
-
59
-
60
-
61
-
62
-
63
-
64
-
65
-
66
-
67
-
68
-
69
-
70
-
71
-
72
-
73
-
74
-
75
-
76
-
77
-
78
-
79
-
80
-
81
-
82
-
83
-
84
-
85
-
86
-
87
-
88
-
89
-
90
-
91
-
92
-
93
-
94
-
95
-
96
-
97
-
98
-
99
-
100
-
101
-
102
-
103
-
104
-
 105
105 -
 106
106 -
 107
107 -
 108
108 -
 109
109 -
 110
110 -
 111
111 -
 112
112 -
 113
113 -
 114
114 -
 115
115 -
 116
116 -
 117
117 -
 118
118 -
 119
119 -
 120
120 -
 121
121 -
 122
122 -
 123
123 -
 124
124 -
 125
125 -
126
-
127
-
128
-
129
-
130
-
131
-
132
-
133
-
134
-
135
-
136
-
137
-
138
-
139
-
140
-
141
 |
 |

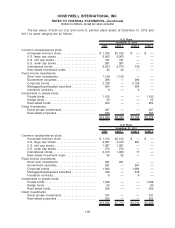
The components of net periodic benefit cost and other amounts recognized in other
comprehensive (income) loss for our significant plans for the years ended December 31, 2012,
2011, and 2010 include the following components:
Net Periodic Benefit Cost 2012 2011 2010 2012 2011 2010
U.S. Plans Non-U.S. Plans
Pension Benefits
Service cost . . . . . . . . . . . . . . . . . . . . . . . . . . . . . . . . . . $ 256 $ 232 $ 221 $ 48 $ 59 $ 51
Interest cost. . . . . . . . . . . . . . . . . . . . . . . . . . . . . . . . . . 738 761 768 221 239 228
Expected return on plan assets . . . . . . . . . . . . . . . (1,020) (1,014) (902) (291) (284) (248)
Amortization of transition obligation . . . . . . . . . . . . — — — 2 2 1
Amortization of prior service cost (credit) . . . . . . 28 33 32 (2) (2) (1)
Recognition of actuarial losses . . . . . . . . . . . . . . . . 707 1,568 182 250 234 289
Settlements and curtailments . . . . . . . . . . . . . . . . . . — 24 — 2 1 4
Net periodic benefit cost . . . . . . . . . . . . . . . . . . . . . . $ 709 $ 1,604 $ 301 $ 230 $ 249 $ 324
Other Changes in Plan Assets and
Benefits Obligations Recognized in
Other Comprehensive (Income) Loss 2012 2011 2010 2012 2011 2010
U.S. Plans Non-U.S. Plans
Actuarial (gains)/losses . . . . . . . . . . . . . . . . . . . . . . . . . $ 859 $ 1,628 $ 325 $ 327 $ 368 $ (20)
Prior service cost (credit) . . . . . . . . . . . . . . . . . . . . . . . — 5 117 — — —
Transition obligation recognized during year . . . . . — — — (2) (2) (1)
Prior service (cost) credit recognized during year.. (28) (33) (32) 2 2 1
Actuarial losses recognized during year . . . . . . . . . (707) (1,568) (182) (250) (234) (289)
Foreign exchange translation adjustments . . . . . . . — — — 23 (11) (17)
Total recognized in other comprehensive
(income) loss . . . . . . . . . . . . . . . . . . . . . . . . . . . . $ 124 $ 32 $ 228 $ 100 $ 123 $(326)
Total recognized in net periodic benefit cost
and other comprehensive (income) loss . . . $ 833 $ 1,636 $ 529 $ 330 $ 372 $ (2)
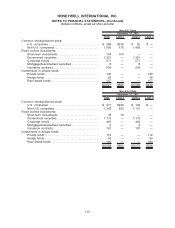
The estimated prior service cost for pension benefits that will be amortized from accumulated
other comprehensive (income) loss into net periodic benefit cost in 2013 are expected to be $23 million
and $(2) million for U.S. and Non-U.S. benefit plans, respectively.
Net Periodic Benefit Cost 2012 2011 2010
Other Postretirement
Benefits Years Ended
December 31,
Service cost. . . . . . . . . . . . . . . . . . . . . . . . . . . . . . . . . . . . . . . . . . . . . . . . . . . . . . . . $ 1 $ 1 $ 2
Interest cost . . . . . . . . . . . . . . . . . . . . . . . . . . . . . . . . . . . . . . . . . . . . . . . . . . . . . . . 53 69 81
Amortization of prior service (credit) . . . . . . . . . . . . . . . . . . . . . . . . . . . . . . . . . (14) (34) (44)
Recognition of actuarial losses . . . . . . . . . . . . . . . . . . . . . . . . . . . . . . . . . . . . . . 34 38 34
Settlements and curtailments . . . . . . . . . . . . . . . . . . . . . . . . . . . . . . . . . . . . . . . (6) (167) (47)
Net periodic benefit (income) cost. . . . . . . . . . . . . . . . . . . . . . . . . . . . . . . . . . . $ 68 $ (93) $ 26
106
HONEYWELL INTERNATIONAL INC.
NOTES TO FINANCIAL STATEMENTS—(Continued)
(Dollars in millions, except per share amounts)