Honeywell 2012 Annual Report Download - page 34
Download and view the complete annual report
Please find page 34 of the 2012 Honeywell annual report below. You can navigate through the pages in the report by either clicking on the pages listed below, or by using the keyword search tool below to find specific information within the annual report.-
 1
1 -
2
-
3
-
4
-
5
-
6
-
7
-
8
-
9
-
10
-
11
-
12
-
13
-
14
-
15
-
16
-
17
-
18
-
19
-
20
-
21
-
22
-
23
-
 24
24 -
 25
25 -
 26
26 -
 27
27 -
 28
28 -
 29
29 -
 30
30 -
 31
31 -
 32
32 -
 33
33 -
 34
34 -
 35
35 -
 36
36 -
 37
37 -
 38
38 -
 39
39 -
 40
40 -
 41
41 -
 42
42 -
 43
43 -
 44
44 -
45
-
46
-
47
-
48
-
49
-
50
-
51
-
52
-
53
-
54
-
55
-
56
-
57
-
58
-
59
-
60
-
61
-
62
-
63
-
64
-
65
-
66
-
67
-
68
-
69
-
70
-
71
-
72
-
73
-
74
-
75
-
76
-
77
-
78
-
79
-
80
-
81
-
82
-
83
-
84
-
85
-
86
-
87
-
88
-
89
-
90
-
91
-
92
-
93
-
94
-
95
-
96
-
97
-
98
-
99
-
100
-
101
-
102
-
103
-
104
-
105
-
106
-
107
-
108
-
109
-
110
-
111
-
112
-
113
-
114
-
115
-
116
-
117
-
118
-
119
-
120
-
121
-
122
-
123
-
124
-
125
-
126
-
127
-
128
-
129
-
130
-
131
-
132
-
133
-
134
-
135
-
136
-
137
-
138
-
139
-
140
-
141
 |
 |
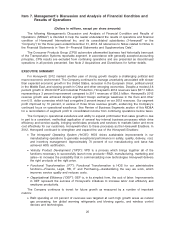
Item 7. Management’s Discussion and Analysis of Financial Condition and
Results of Operations
(Dollars in millions, except per share amounts)
The following Management’s Discussion and Analysis of Financial Condition and Results of
Operations (“MD&A”) is intended to help the reader understand the results of operations and financial
condition of Honeywell International Inc. and its consolidated subsidiaries (“Honeywell” or the
“Company”) for the three years ended December 31, 2012. All references to Notes related to Notes to
the Financial Statements in “Item 8—Financial Statements and Supplementary Data”.
The Consumer Products Group (CPG) automotive aftermarket business had historically been part
of the Transportation Systems reportable segment. In accordance with generally accepted accounting
principles, CPG results are excluded from continuing operations and are presented as discontinued
operations in all periods presented. See Note 2 Acquisitions and Divestitures for further details.
EXECUTIVE SUMMARY
For Honeywell, 2012 marked another year of strong growth despite a challenging political and
macro-economic environment. The Company continued to manage uncertainty associated with slower
than expected economic growth in the United States, recession in the European Union, political unrest
in the Middle East, and slowing growth in China and other emerging economies. Despite a modest 2.6
percent growth in World GDP and Industrial Production, Honeywell’s 2012 revenues were $37.7 billion
representing a 3 percent improvement compared to 2011 revenues of $36.5 billion. Honeywell’s 2012
revenue growth was achieved despite significant foreign exchange weakness in the Euro and other
non-U.S. dollar currencies which had a negative 2 percent impact on our 2012 revenues. Our segment
profit improved by 10 percent, in excess of three times revenue growth, evidencing the Company’s
continued focus on operational excellence. See Review of Business Segments section of this MD&A
for a reconciliation of segment profit to consolidated income from continuing operations before taxes.
The Company’s operational excellence and ability to expand profit faster than sales growth is due
in part to a consistent, methodical application of several key internal business processes which drive
efficiency and service quality, bringing world-class products and services to markets faster and more
cost effectively for our customers. Honeywell refers to these processes as the Honeywell Enablers. In
2012, Honeywell continued to strengthen and expand the use of the Honeywell Enablers:
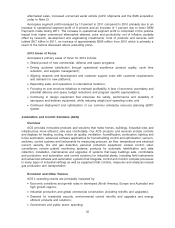
•The Honeywell Operating System (“HOS”): HOS drives sustainable improvements in our
manufacturing operations to generate exceptional performance in safety, quality, delivery, cost,
and inventory management. Approximately 70 percent of our manufacturing cost base has
achieved HOS certification.
•Velocity Product Development (“VPD”): VPD is a process which brings together all of the
functions necessary to successfully launch new products—R&D, manufacturing, marketing and
sales—to increase the probability that in commercializing new technologies Honeywell delivers
the right products at the right price.
•Functional Transformation (“FT”): Functional Transformation is HOS for our administrative
functions—Finance, Legal, HR, IT and Purchasing—standardizing the way we work, which
improves service quality and reduces costs.
•Organizational Efficiency (“OEF”): OEF is, in its simplest form, the cost of labor. Improvements
in OEF represent the success of Honeywell’s initiatives to increase labor cost efficiency and
employee productivity.
The Company continues to invest for future growth as measured by a number of important
metrics:
•R&D spending at 4.9 percent of revenues was targeted at such high growth areas as natural
gas processing, low global warming refrigerants and blowing agents, and wireless control
devices and technologies.
25