Honeywell 2012 Annual Report Download - page 38
Download and view the complete annual report
Please find page 38 of the 2012 Honeywell annual report below. You can navigate through the pages in the report by either clicking on the pages listed below, or by using the keyword search tool below to find specific information within the annual report.-
 1
1 -
2
-
3
-
4
-
5
-
6
-
7
-
8
-
9
-
10
-
11
-
12
-
13
-
14
-
15
-
16
-
17
-
18
-
19
-
20
-
21
-
22
-
23
-
24
-
25
-
26
-
27
-
 28
28 -
 29
29 -
 30
30 -
 31
31 -
 32
32 -
 33
33 -
 34
34 -
 35
35 -
 36
36 -
 37
37 -
 38
38 -
 39
39 -
 40
40 -
 41
41 -
 42
42 -
 43
43 -
 44
44 -
 45
45 -
 46
46 -
 47
47 -
 48
48 -
49
-
50
-
51
-
52
-
53
-
54
-
55
-
56
-
57
-
58
-
59
-
60
-
61
-
62
-
63
-
64
-
65
-
66
-
67
-
68
-
69
-
70
-
71
-
72
-
73
-
74
-
75
-
76
-
77
-
78
-
79
-
80
-
81
-
82
-
83
-
84
-
85
-
86
-
87
-
88
-
89
-
90
-
91
-
92
-
93
-
94
-
95
-
96
-
97
-
98
-
99
-
100
-
101
-
102
-
103
-
104
-
105
-
106
-
107
-
108
-
109
-
110
-
111
-
112
-
113
-
114
-
115
-
116
-
117
-
118
-
119
-
120
-
121
-
122
-
123
-
124
-
125
-
126
-
127
-
128
-
129
-
130
-
131
-
132
-
133
-
134
-
135
-
136
-
137
-
138
-
139
-
140
-
141
 |
 |

recorded in the first quarter of 2013, however, the 2013 effective tax rate could also change based
upon the Company’s operating results, mix of earnings and the outcome of tax positions taken
regarding previously filed tax returns currently under audit by various Federal, State and foreign tax
authorities, several of which may be finalized in the foreseeable future. The Company believes that it
has adequate reserves for these matters. However, the ultimate outcome of these matters may differ
and could materially impact the results of operations and operating cash flows in the period they are
resolved.
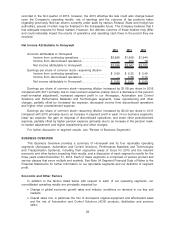
Net Income Attributable to Honeywell
2012 2011 2010
Amounts attributable to Honeywell
Income from continuing operations . . . . . . . . . . . . . . . . . . . . $2,926 $1,858 $1,944
Income from discontinued operations . . . . . . . . . . . . . . . . . . — 209 78
Net income attributable to Honeywell . . . . . . . . . . . . . . . . . . $2,926 $2,067 $2,022
Earnings per share of common stock—assuming dilution
Income from continuing operations . . . . . . . . . . . . . . . . . . . . $ 3.69 $ 2.35 $ 2.49
Income from discontinued operations . . . . . . . . . . . . . . . . . . — 0.26 0.10
Net income attributable to Honeywell . . . . . . . . . . . . . . . . . . $ 3.69 $ 2.61 $ 2.59
Earnings per share of common stock—assuming dilution increased by $1.08 per share in 2012
compared with 2011 primarily due to lower pension expense (mainly due to a decrease in the pension
mark-to-market adjustment), increased segment profit in our Aerospace, Automation and Control
Solutions and Performance Materials and Technologies segments, lower repositioning and other
charges, partially offset by increased tax expense, decreased income from discontinued operations
and higher other postretirement expense.
Earnings per share of common stock—assuming dilution increased by $0.02 per share in 2011
compared with 2010 primarily due to an increase in segment profit in each of our business segments,
lower tax expense, the gain on disposal of discontinued operations, and lower other postretirement
expense, partially offset by higher pension expense (primarily due to an increase in the pension mark-
to-market adjustment) and higher repositioning and other charges.
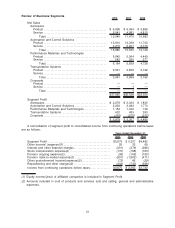
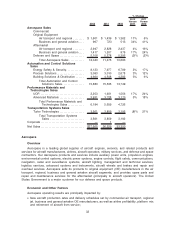
For further discussion of segment results, see “Review of Business Segments”.
BUSINESS OVERVIEW
This Business Overview provides a summary of Honeywell and its four reportable operating
segments (Aerospace, Automation and Control Solutions, Performance Materials and Technologies
and Transportation Systems), including their respective areas of focus for 2013 and the relevant
economic and other factors impacting their results, and a discussion of each segment’s results for the
three years ended December 31, 2012. Each of these segments is comprised of various product and
service classes that serve multiple end markets. See Note 24 Segment Financial Data of Notes to the
Financial Statements for further information on our reportable segments and our definition of segment
profit.
Economic and Other Factors
In addition to the factors listed below with respect to each of our operating segments, our
consolidated operating results are principally impacted by:
•Change in global economic growth rates and industry conditions on demand in our key end
markets;
•Overall sales mix, in particular the mix of Aerospace original equipment and aftermarket sales
and the mix of Automation and Control Solutions (ACS) products, distribution and services
sales;
29