Honeywell 2012 Annual Report Download - page 120
Download and view the complete annual report
Please find page 120 of the 2012 Honeywell annual report below. You can navigate through the pages in the report by either clicking on the pages listed below, or by using the keyword search tool below to find specific information within the annual report.-
 1
1 -
2
-
3
-
4
-
5
-
6
-
7
-
8
-
9
-
10
-
11
-
12
-
13
-
14
-
15
-
16
-
17
-
18
-
19
-
20
-
21
-
22
-
23
-
24
-
25
-
26
-
27
-
28
-
29
-
30
-
31
-
32
-
33
-
34
-
35
-
36
-
37
-
38
-
39
-
40
-
41
-
42
-
43
-
44
-
45
-
46
-
47
-
48
-
49
-
50
-
51
-
52
-
53
-
54
-
55
-
56
-
57
-
58
-
59
-
60
-
61
-
62
-
63
-
64
-
65
-
66
-
67
-
68
-
69
-
70
-
71
-
72
-
73
-
74
-
75
-
76
-
77
-
78
-
79
-
80
-
81
-
82
-
83
-
84
-
85
-
86
-
87
-
88
-
89
-
90
-
91
-
92
-
93
-
94
-
95
-
96
-
97
-
98
-
99
-
100
-
101
-
102
-
103
-
104
-
105
-
106
-
107
-
108
-
109
-
 110
110 -
 111
111 -
 112
112 -
 113
113 -
 114
114 -
 115
115 -
 116
116 -
 117
117 -
 118
118 -
 119
119 -
 120
120 -
 121
121 -
 122
122 -
 123
123 -
 124
124 -
 125
125 -
 126
126 -
 127
127 -
 128
128 -
 129
129 -
 130
130 -
131
-
132
-
133
-
134
-
135
-
136
-
137
-
138
-
139
-
140
-
141
 |
 |

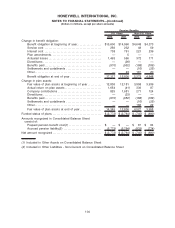
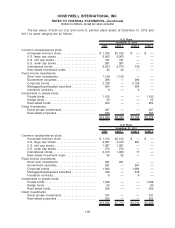
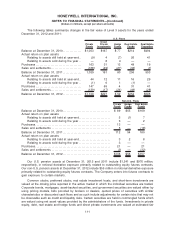
The following tables summarize changes in the fair value of Level 3 assets for the years ended
December 31, 2012 and 2011:
Private
Funds
Direct
Private
Investments
Hedge
Funds
Real Estate
Funds
Real Estate
Properties
U.S. Plans
Balance at December 31, 2010. . . . . . . . . . . . . . $1,053 $167 $ 77 $214 $494
Actual return on plan assets:
Relating to assets still held at year-end . . (9) 4 (7) 26 41
Relating to assets sold during the year . . — 8 4 — —
Purchases . . . . . . . . . . . . . . . . . . . . . . . . . . . . . . . . . . 163 31 13 48 19
Sales and settlements. . . . . . . . . . . . . . . . . . . . . . . (168) (49) (27) (32) (1)
Balance at December 31, 2011. . . . . . . . . . . . . . 1,039 161 60 256 553
Actual return on plan assets:
Relating to assets still held at year-end . . 44 12 11 16 29
Relating to assets sold during the year . . (1) 6 1 (1) —
Purchases . . . . . . . . . . . . . . . . . . . . . . . . . . . . . . . . . . 147 65 4 31 41
Sales and settlements. . . . . . . . . . . . . . . . . . . . . . . (129) (17) (24) (48) (28)
Balance at December 31, 2012. . . . . . . . . . . . . . $1,100 $227 $ 52 $254 $595
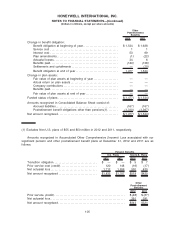
Private
Funds
Hedge
Funds
Real Estate
Funds
Non-U.S. Plans
Balance at December 31, 2010. . . . . . . . . . . . . . . . . . . . . . . . . . . . . . . . . . . $ 89 $55 $169
Actual return on plan assets:
Relating to assets still held at year-end. . . . . . . . . . . . . . . . . . . . . . . 2 (1) 7
Relating to assets sold during the year . . . . . . . . . . . . . . . . . . . . . . . 3 — 2
Purchases . . . . . . . . . . . . . . . . . . . . . . . . . . . . . . . . . . . . . . . . . . . . . . . . . . . . . . . 13 — —
Sales and settlements . . . . . . . . . . . . . . . . . . . . . . . . . . . . . . . . . . . . . . . . . . . 5 — (18)
Balance at December 31, 2011. . . . . . . . . . . . . . . . . . . . . . . . . . . . . . . . . . . 112 54 160
Actual return on plan assets:
Relating to assets still held at year-end. . . . . . . . . . . . . . . . . . . . . . . 3 2 8
Relating to assets sold during the year . . . . . . . . . . . . . . . . . . . . . . . 3 — —
Purchases . . . . . . . . . . . . . . . . . . . . . . . . . . . . . . . . . . . . . . . . . . . . . . . . . . . . . . . 21 — 21
Sales and settlements . . . . . . . . . . . . . . . . . . . . . . . . . . . . . . . . . . . . . . . . . . . (3) — (32)
Balance at December 31, 2012. . . . . . . . . . . . . . . . . . . . . . . . . . . . . . . . . . . $136 $56 $157
Our U.S. pension assets at December 31, 2012 and 2011 include $1,241 and $976 million,
respectively, in notional derivative exposure primarily related to outstanding equity futures contracts.
Our non-U.S. pension assets at December 31, 2012 include $55 million in notional derivative exposure
primarily related to outstanding equity futures contracts. The Company enters into futures contracts to
gain exposure to certain markets.
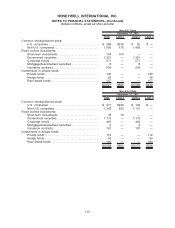
Common stocks, preferred stocks, real estate investment trusts, and short-term investments are
valued at the closing price reported in the active market in which the individual securities are traded.
Corporate bonds, mortgages, asset-backed securities, and government securities are valued either by
using pricing models, bids provided by brokers or dealers, quoted prices of securities with similar
characteristics or discounted cash flows and as such include adjustments for certain risks that may not
be observable such as credit and liquidity risks. Certain securities are held in commingled funds which
are valued using net asset values provided by the administrators of the funds. Investments in private
equity, debt, real estate and hedge funds and direct private investments are valued at estimated fair
111
HONEYWELL INTERNATIONAL INC.
NOTES TO FINANCIAL STATEMENTS—(Continued)
(Dollars in millions, except per share amounts)