Honeywell 2012 Annual Report Download - page 52
Download and view the complete annual report
Please find page 52 of the 2012 Honeywell annual report below. You can navigate through the pages in the report by either clicking on the pages listed below, or by using the keyword search tool below to find specific information within the annual report.-
 1
1 -
2
-
3
-
4
-
5
-
6
-
7
-
8
-
9
-
10
-
11
-
12
-
13
-
14
-
15
-
16
-
17
-
18
-
19
-
20
-
21
-
22
-
23
-
24
-
25
-
26
-
27
-
28
-
29
-
30
-
31
-
32
-
33
-
34
-
35
-
36
-
37
-
38
-
39
-
40
-
41
-
 42
42 -
 43
43 -
 44
44 -
 45
45 -
 46
46 -
 47
47 -
 48
48 -
 49
49 -
 50
50 -
 51
51 -
 52
52 -
 53
53 -
 54
54 -
 55
55 -
 56
56 -
 57
57 -
 58
58 -
 59
59 -
 60
60 -
 61
61 -
 62
62 -
63
-
64
-
65
-
66
-
67
-
68
-
69
-
70
-
71
-
72
-
73
-
74
-
75
-
76
-
77
-
78
-
79
-
80
-
81
-
82
-
83
-
84
-
85
-
86
-
87
-
88
-
89
-
90
-
91
-
92
-
93
-
94
-
95
-
96
-
97
-
98
-
99
-
100
-
101
-
102
-
103
-
104
-
105
-
106
-
107
-
108
-
109
-
110
-
111
-
112
-
113
-
114
-
115
-
116
-
117
-
118
-
119
-
120
-
121
-
122
-
123
-
124
-
125
-
126
-
127
-
128
-
129
-
130
-
131
-
132
-
133
-
134
-
135
-
136
-
137
-
138
-
139
-
140
-
141
 |
 |

LIQUIDITY AND CAPITAL RESOURCES
The Company continues to manage its businesses to maximize operating cash flows as the
primary source of liquidity. In addition to our available cash and operating cash flows, additional
sources of liquidity include committed credit lines, short-term debt from the commercial paper market,
long-term borrowings, and access to the public debt and equity markets, as well as the ability to sell
trade accounts receivables. We continue to balance our cash and financing uses through investment in
our existing core businesses, acquisition activity, share repurchases and dividends.
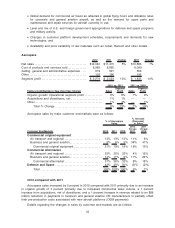
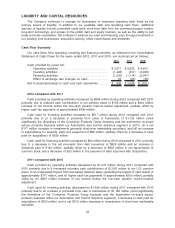
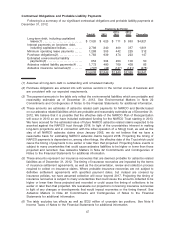
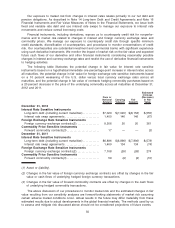
Cash Flow Summary
Our cash flows from operating, investing and financing activities, as reflected in the Consolidated
Statement of Cash Flows for the years ended 2012, 2011 and 2010, are summarized as follows:
2012 2011 2010
Cash provided by (used for):
Operating activities. . . . . . . . . . . . . . . . . . . . . . . . . . . . . . . . . . . . . $ 3,517 $ 2,833 $ 4,203
Investing activities. . . . . . . . . . . . . . . . . . . . . . . . . . . . . . . . . . . . . . (1,428) (611) (2,269)
Financing activities . . . . . . . . . . . . . . . . . . . . . . . . . . . . . . . . . . . . . (1,206) (1,114) (2,047)
Effect of exchange rate changes on cash . . . . . . . . . . . . . . . 53 (60) (38)
Net increase/(decrease) in cash and cash equivalents . . . . . . . $ 936 $ 1,048 $ (151)
2012 compared with 2011
Cash provided by operating activities increased by $684 million during 2012 compared with 2011
primarily due to reduced cash contributions to our pension plans of $706 million and a $344 million
increase of net income before the non-cash pension mark-to-market adjustment, partially offset by
higher cash tax payments of approximately $340 million.
Cash used for investing activities increased by $817 million during 2012 compared with 2011
primarily due to (i) a decrease in proceeds from sales of businesses of $1,135 million (most
significantly the divestiture of the Consumer Products Group business and the automotive on-board
sensor products business within our Automation and Control Solutions segment in 2011), (ii) a net
$117 million increase in investments (primarily short-term marketable securities), and (iii) an increase
in expenditures for property, plant and equipment of $86 million, partially offset by a decrease in cash
paid for acquisitions of $535 million.
Cash used for financing activities increased by $92 million during 2012 compared to 2011 primarily
due to a decrease in the net proceeds from debt issuances of $825 million and an increase in
dividends paid of $120 million, partially offset by a decrease of $806 million in net repurchases of
common stock and a decrease of $33 million in the payment of debt assumed with acquisitions.
2011 compared with 2010
Cash provided by operating activities decreased by $1,370 million during 2011 compared with
2010 primarily due to i) increased voluntary cash contributions of $1,050 million to our U.S. pension
plans, ii) an unfavorable impact from decreased deferred taxes (excluding the impact of cash taxes) of
approximately $710 million, and iii) higher cash tax payments of approximately $500 million, partially
offset by an $863 million increase of net income before the non-cash pension mark-to-market
adjustment.
Cash used for investing activities decreased by $1,658 million during 2011 compared with 2010
primarily due to an increase in proceeds from sale of businesses of $1,149 million (most significantly
the divestiture of the Consumer Products Group business and the automotive on-board sensor
products business within our Automation and Control Solutions segment), a decrease in cash paid for
acquisitions of $330 million, and a net $315 million decrease in investments of short-term marketable
securities.
43