Honeywell 2012 Annual Report Download - page 51
Download and view the complete annual report
Please find page 51 of the 2012 Honeywell annual report below. You can navigate through the pages in the report by either clicking on the pages listed below, or by using the keyword search tool below to find specific information within the annual report.-
 1
1 -
2
-
3
-
4
-
5
-
6
-
7
-
8
-
9
-
10
-
11
-
12
-
13
-
14
-
15
-
16
-
17
-
18
-
19
-
20
-
21
-
22
-
23
-
24
-
25
-
26
-
27
-
28
-
29
-
30
-
31
-
32
-
33
-
34
-
35
-
36
-
37
-
38
-
39
-
40
-
 41
41 -
 42
42 -
 43
43 -
 44
44 -
 45
45 -
 46
46 -
 47
47 -
 48
48 -
 49
49 -
 50
50 -
 51
51 -
 52
52 -
 53
53 -
 54
54 -
 55
55 -
 56
56 -
 57
57 -
 58
58 -
 59
59 -
 60
60 -
 61
61 -
62
-
63
-
64
-
65
-
66
-
67
-
68
-
69
-
70
-
71
-
72
-
73
-
74
-
75
-
76
-
77
-
78
-
79
-
80
-
81
-
82
-
83
-
84
-
85
-
86
-
87
-
88
-
89
-
90
-
91
-
92
-
93
-
94
-
95
-
96
-
97
-
98
-
99
-
100
-
101
-
102
-
103
-
104
-
105
-
106
-
107
-
108
-
109
-
110
-
111
-
112
-
113
-
114
-
115
-
116
-
117
-
118
-
119
-
120
-
121
-
122
-
123
-
124
-
125
-
126
-
127
-
128
-
129
-
130
-
131
-
132
-
133
-
134
-
135
-
136
-
137
-
138
-
139
-
140
-
141
 |
 |

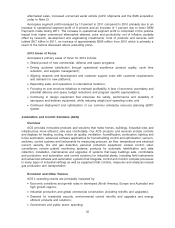
•Maintaining the high quality of current products while executing new product introductions;
•Increasing global penetration and share of diesel and gasoline turbocharger OEM demand;
•Reducing manufacturing costs through increasing plant productivity and an improving global
manufacturing footprint;
•Aligning cost structure with current economic outlook, and successful execution of repositioning
actions; and
•Aligning development efforts and costs with new turbo platform launch schedules.
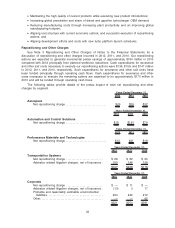
Repositioning and Other Charges
See Note 3 Repositioning and Other Charges of Notes to the Financial Statements for a
discussion of repositioning and other charges incurred in 2012, 2011, and 2010. Our repositioning
actions are expected to generate incremental pretax savings of approximately $150 million in 2013
compared with 2012 principally from planned workforce reductions. Cash expenditures for severance
and other exit costs necessary to execute our repositioning actions were $136, $159, and $147 million
in 2012, 2011, and 2010, respectively. Such expenditures for severance and other exit costs have
been funded principally through operating cash flows. Cash expenditures for severance and other
costs necessary to execute the remaining actions are expected to be approximately $175 million in
2013 and will be funded through operating cash flows.
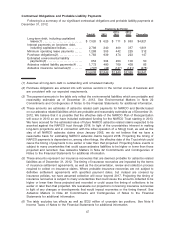
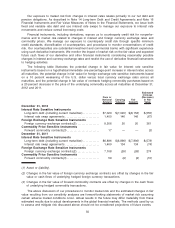
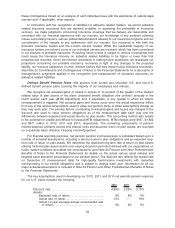
The following tables provide details of the pretax impact of total net repositioning and other
charges by segment.
2012 2011 2010
Years Ended December 31,
Aerospace
Net repositioning charge . . . . . . . . . . . . . . . . . . . . . . . . . . . . . . $(5) $29 $32
2012 2011 2010
Years Ended December 31,
Automation and Control Solutions
Net repositioning charge . . . . . . . . . . . . . . . . . . . . . . . . . . . . . $18 $191 $79
2012 2011 2010
Years Ended December 31,
Performance Materials and Technologies
Net repositioning charge . . . . . . . . . . . . . . . . . . . . . . . . . . . . . . $12 $41 $18
2012 2011 2010
Years Ended December 31,
Transportation Systems
Net repositioning charge . . . . . . . . . . . . . . . . . . . . . . . . . . . $ 28 $ 82 $ 20
Asbestos related litigation charges, net of insurance . 169 146 158
$197 $228 $178
2012 2011 2010
Years Ended December 31,
Corporate
Net repositioning charge . . . . . . . . . . . . . . . . . . . . . . . . . . . $ — $ 11 $ —
Asbestos related litigation charges, net of insurance . (13) 3 17
Probable and reasonably estimable environmental
liabilities . . . . . . . . . . . . . . . . . . . . . . . . . . . . . . . . . . . . . . . . . 234 240 212
Other. . . . . . . . . . . . . . . . . . . . . . . . . . . . . . . . . . . . . . . . . . . . . . — — 62
$221 $254 $291
42