Honeywell 2012 Annual Report Download - page 123
Download and view the complete annual report
Please find page 123 of the 2012 Honeywell annual report below. You can navigate through the pages in the report by either clicking on the pages listed below, or by using the keyword search tool below to find specific information within the annual report.-
 1
1 -
2
-
3
-
4
-
5
-
6
-
7
-
8
-
9
-
10
-
11
-
12
-
13
-
14
-
15
-
16
-
17
-
18
-
19
-
20
-
21
-
22
-
23
-
24
-
25
-
26
-
27
-
28
-
29
-
30
-
31
-
32
-
33
-
34
-
35
-
36
-
37
-
38
-
39
-
40
-
41
-
42
-
43
-
44
-
45
-
46
-
47
-
48
-
49
-
50
-
51
-
52
-
53
-
54
-
55
-
56
-
57
-
58
-
59
-
60
-
61
-
62
-
63
-
64
-
65
-
66
-
67
-
68
-
69
-
70
-
71
-
72
-
73
-
74
-
75
-
76
-
77
-
78
-
79
-
80
-
81
-
82
-
83
-
84
-
85
-
86
-
87
-
88
-
89
-
90
-
91
-
92
-
93
-
94
-
95
-
96
-
97
-
98
-
99
-
100
-
101
-
102
-
103
-
104
-
105
-
106
-
107
-
108
-
109
-
110
-
111
-
112
-
 113
113 -
 114
114 -
 115
115 -
 116
116 -
 117
117 -
 118
118 -
 119
119 -
 120
120 -
 121
121 -
 122
122 -
 123
123 -
 124
124 -
 125
125 -
 126
126 -
 127
127 -
 128
128 -
 129
129 -
 130
130 -
 131
131 -
 132
132 -
 133
133 -
134
-
135
-
136
-
137
-
138
-
139
-
140
-
141
 |
 |

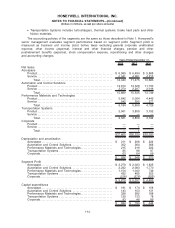
•Transportation Systems includes turbochargers, thermal systems, brake hard parts and other
friction materials.
The accounting policies of the segments are the same as those described in Note 1. Honeywell’s
senior management evaluates segment performance based on segment profit. Segment profit is
measured as business unit income (loss) before taxes excluding general corporate unallocated
expense, other income (expense), interest and other financial charges, pension and other
postretirement benefits (expense), stock compensation expense, repositioning and other charges
and accounting changes.
2012 2011 2010
Years Ended December 31,
Net Sales
Aerospace
Product. . . . . . . . . . . . . . . . . . . . . . . . . . . . . . . . . . . . . . . . . . . . . . . . . . . . . . . $ 6,999 $ 6,494 $ 5,868
Service . . . . . . . . . . . . . . . . . . . . . . . . . . . . . . . . . . . . . . . . . . . . . . . . . . . . . . . 5,041 4,981 4,815
Total . . . . . . . . . . . . . . . . . . . . . . . . . . . . . . . . . . . . . . . . . . . . . . . . . . . . . 12,040 11,475 10,683
Automation and Control Solutions
Product. . . . . . . . . . . . . . . . . . . . . . . . . . . . . . . . . . . . . . . . . . . . . . . . . . . . . . . 13,610 13,328 11,733
Service . . . . . . . . . . . . . . . . . . . . . . . . . . . . . . . . . . . . . . . . . . . . . . . . . . . . . . . 2,270 2,207 2,016
Total . . . . . . . . . . . . . . . . . . . . . . . . . . . . . . . . . . . . . . . . . . . . . . . . . . . . . 15,880 15,535 13,749
Performance Materials and Technologies
Product. . . . . . . . . . . . . . . . . . . . . . . . . . . . . . . . . . . . . . . . . . . . . . . . . . . . . . . 5,642 5,064 4,449
Service . . . . . . . . . . . . . . . . . . . . . . . . . . . . . . . . . . . . . . . . . . . . . . . . . . . . . . . 542 595 277
Total . . . . . . . . . . . . . . . . . . . . . . . . . . . . . . . . . . . . . . . . . . . . . . . . . . . . . 6,184 5,659 4,726
Transportation Systems
Product. . . . . . . . . . . . . . . . . . . . . . . . . . . . . . . . . . . . . . . . . . . . . . . . . . . . . . . 3,561 3,859 3,192
Service . . . . . . . . . . . . . . . . . . . . . . . . . . . . . . . . . . . . . . . . . . . . . . . . . . . . . . . — — —
Total . . . . . . . . . . . . . . . . . . . . . . . . . . . . . . . . . . . . . . . . . . . . . . . . . . . . . 3,561 3,859 3,192
Corporate
Product. . . . . . . . . . . . . . . . . . . . . . . . . . . . . . . . . . . . . . . . . . . . . . . . . . . . . . . — — —
Service . . . . . . . . . . . . . . . . . . . . . . . . . . . . . . . . . . . . . . . . . . . . . . . . . . . . . . . — 1 —
Total . . . . . . . . . . . . . . . . . . . . . . . . . . . . . . . . . . . . . . . . . . . . . . . . . . . . . — 1 —
$37,665 $36,529 $32,350
Depreciation and amortization
Aerospace . . . . . . . . . . . . . . . . . . . . . . . . . . . . . . . . . . . . . . . . . . . . . . . . . . . . $ 211 $ 208 $ 224
Automation and Control Solutions . . . . . . . . . . . . . . . . . . . . . . . . . . . . . . 352 364 368
Performance Materials and Technologies. . . . . . . . . . . . . . . . . . . . . . . 215 216 222
Transportation Systems . . . . . . . . . . . . . . . . . . . . . . . . . . . . . . . . . . . . . . . 85 96 97
Corporate. . . . . . . . . . . . . . . . . . . . . . . . . . . . . . . . . . . . . . . . . . . . . . . . . . . . . 63 64 59
$ 926 $ 948 $ 970
Segment Profit
Aerospace . . . . . . . . . . . . . . . . . . . . . . . . . . . . . . . . . . . . . . . . . . . . . . . . . . . . $ 2,279 $ 2,023 $ 1,835
Automation and Control Solutions . . . . . . . . . . . . . . . . . . . . . . . . . . . . . . 2,232 2,083 1,770
Performance Materials and Technologies. . . . . . . . . . . . . . . . . . . . . . . 1,154 1,042 749
Transportation Systems . . . . . . . . . . . . . . . . . . . . . . . . . . . . . . . . . . . . . . . 432 485 353
Corporate. . . . . . . . . . . . . . . . . . . . . . . . . . . . . . . . . . . . . . . . . . . . . . . . . . . . . (218) (276) (222)
$ 5,879 $ 5,357 $ 4,485
Capital expenditures
Aerospace . . . . . . . . . . . . . . . . . . . . . . . . . . . . . . . . . . . . . . . . . . . . . . . . . . . . $ 191 $ 174 $ 158
Automation and Control Solutions . . . . . . . . . . . . . . . . . . . . . . . . . . . . . . 143 153 131
Performance Materials and Technologies. . . . . . . . . . . . . . . . . . . . . . . 328 282 188
Transportation Systems . . . . . . . . . . . . . . . . . . . . . . . . . . . . . . . . . . . . . . . 129 133 78
Corporate. . . . . . . . . . . . . . . . . . . . . . . . . . . . . . . . . . . . . . . . . . . . . . . . . . . . . 93 48 89
$ 884 $ 790 $ 644
114
HONEYWELL INTERNATIONAL INC.
NOTES TO FINANCIAL STATEMENTS—(Continued)
(Dollars in millions, except per share amounts)