Honeywell 2012 Annual Report Download - page 95
Download and view the complete annual report
Please find page 95 of the 2012 Honeywell annual report below. You can navigate through the pages in the report by either clicking on the pages listed below, or by using the keyword search tool below to find specific information within the annual report.-
 1
1 -
2
-
3
-
4
-
5
-
6
-
7
-
8
-
9
-
10
-
11
-
12
-
13
-
14
-
15
-
16
-
17
-
18
-
19
-
20
-
21
-
22
-
23
-
24
-
25
-
26
-
27
-
28
-
29
-
30
-
31
-
32
-
33
-
34
-
35
-
36
-
37
-
38
-
39
-
40
-
41
-
42
-
43
-
44
-
45
-
46
-
47
-
48
-
49
-
50
-
51
-
52
-
53
-
54
-
55
-
56
-
57
-
58
-
59
-
60
-
61
-
62
-
63
-
64
-
65
-
66
-
67
-
68
-
69
-
70
-
71
-
72
-
73
-
74
-
75
-
76
-
77
-
78
-
79
-
80
-
81
-
82
-
83
-
84
-
 85
85 -
 86
86 -
 87
87 -
 88
88 -
 89
89 -
 90
90 -
 91
91 -
 92
92 -
 93
93 -
 94
94 -
 95
95 -
 96
96 -
 97
97 -
 98
98 -
 99
99 -
 100
100 -
 101
101 -
 102
102 -
 103
103 -
 104
104 -
 105
105 -
106
-
107
-
108
-
109
-
110
-
111
-
112
-
113
-
114
-
115
-
116
-
117
-
118
-
119
-
120
-
121
-
122
-
123
-
124
-
125
-
126
-
127
-
128
-
129
-
130
-
131
-
132
-
133
-
134
-
135
-
136
-
137
-
138
-
139
-
140
-
141
 |
 |
currency forward contracts. Changes in the forecasted non-functional currency cash flows due to
movements in exchange rates are substantially offset by changes in the fair value of the currency
forward contracts designated as hedges. Market value gains and losses on these contracts are
recognized in earnings when the hedged transaction is recognized. Open foreign currency exchange
forward contracts mature predominantly in the next twelve months. At December 31, 2012 and 2011,
we had contracts with notional amounts of $8,506 million and $7,108 million, respectively, to exchange
foreign currencies, principally the U.S. dollar, Euro, British pound, Canadian dollar, Chinese renminbi,
Mexican peso, Indian rupee, Korean won, Czech koruna, Hong Kong dollar, Singapore dollar,
Romanian leu, Swiss franc, Swedish krona, and Thai baht.
Commodity Price Risk Management—Our exposure to market risk for commodity prices can
result in changes in our cost of production. We primarily mitigate our exposure to commodity price risk
through the use of long-term, fixed-price contracts with our suppliers and formula price agreements
with suppliers and customers. We also enter into forward commodity contracts with third parties
designated as hedges of anticipated purchases of several commodities. Forward commodity contracts
are marked-to-market, with the resulting gains and losses recognized in earnings when the hedged
transaction is recognized. At December 31, 2012 and 2011, we had contracts with notional amounts of
$17 million and $59 million, respectively, related to forward commodity agreements, principally base
metals and natural gas.
Interest Rate Risk Management—We use a combination of financial instruments, including long-
term, medium-term and short-term financing, variable-rate commercial paper, and interest rate swaps
to manage the interest rate mix of our total debt portfolio and related overall cost of borrowing. At
December 31, 2012 and 2011, interest rate swap agreements designated as fair value hedges
effectively changed $1,400 million of fixed rate debt at a rate of 4.09 to LIBOR based floating rate debt.
Our interest rate swaps mature at various dates through 2021.
Fair Value of Financial Instruments—The FASB’s accounting guidance defines fair value as the
price that would be received to sell an asset or paid to transfer a liability in an orderly transaction
between market participants at the measurement date (exit price). The FASB’s guidance classifies the
inputs used to measure fair value into the following hierarchy:
Level 1 Unadjusted quoted prices in active markets for identical assets
or liabilities
Level 2 Unadjusted quoted prices in active markets for similar assets
or liabilities, or
Unadjusted quoted prices for identical or similar assets or
liabilities in markets that are not active, or
Inputs other than quoted prices that are observable for the
asset or liability
Level 3 Unobservable inputs for the asset or liability
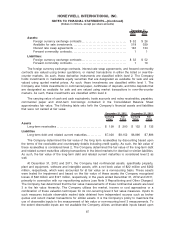
The Company endeavors to utilize the best available information in measuring fair value. Financial
and nonfinancial assets and liabilities are classified in their entirety based on the lowest level of input
that is significant to the fair value measurement. The following table sets forth the Company’s financial
assets and liabilities that were accounted for at fair value on a recurring basis as of December 31,
2012 and 2011:
86
HONEYWELL INTERNATIONAL INC.
NOTES TO FINANCIAL STATEMENTS—(Continued)
(Dollars in millions, except per share amounts)