Honeywell 2012 Annual Report Download - page 49
Download and view the complete annual report
Please find page 49 of the 2012 Honeywell annual report below. You can navigate through the pages in the report by either clicking on the pages listed below, or by using the keyword search tool below to find specific information within the annual report.-
 1
1 -
2
-
3
-
4
-
5
-
6
-
7
-
8
-
9
-
10
-
11
-
12
-
13
-
14
-
15
-
16
-
17
-
18
-
19
-
20
-
21
-
22
-
23
-
24
-
25
-
26
-
27
-
28
-
29
-
30
-
31
-
32
-
33
-
34
-
35
-
36
-
37
-
38
-
 39
39 -
 40
40 -
 41
41 -
 42
42 -
 43
43 -
 44
44 -
 45
45 -
 46
46 -
 47
47 -
 48
48 -
 49
49 -
 50
50 -
 51
51 -
 52
52 -
 53
53 -
 54
54 -
 55
55 -
 56
56 -
 57
57 -
 58
58 -
 59
59 -
60
-
61
-
62
-
63
-
64
-
65
-
66
-
67
-
68
-
69
-
70
-
71
-
72
-
73
-
74
-
75
-
76
-
77
-
78
-
79
-
80
-
81
-
82
-
83
-
84
-
85
-
86
-
87
-
88
-
89
-
90
-
91
-
92
-
93
-
94
-
95
-
96
-
97
-
98
-
99
-
100
-
101
-
102
-
103
-
104
-
105
-
106
-
107
-
108
-
109
-
110
-
111
-
112
-
113
-
114
-
115
-
116
-
117
-
118
-
119
-
120
-
121
-
122
-
123
-
124
-
125
-
126
-
127
-
128
-
129
-
130
-
131
-
132
-
133
-
134
-
135
-
136
-
137
-
138
-
139
-
140
-
141
 |
 |
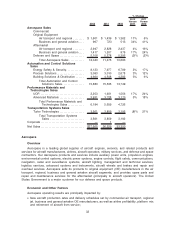
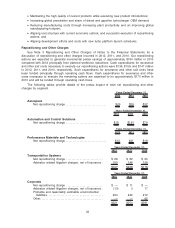
slowing global demand and lower prices resulting from increased availability of refrigerants
supply.
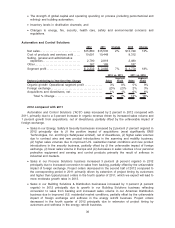
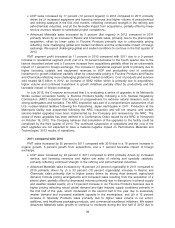
PMT segment profit increased by 39 percent in 2011 compared with 2010 due to a 38 percent
increase in operational segment profit and a 1 percent favorable impact of foreign exchange. The
increase in operational segment profit is primarily due to the favorable price to raw materials spread in
Resins and Chemicals and Fluorine Products and higher service, product and licensing revenues in
UOP, partially offset by continued investment in growth and plant optimization initiatives. Cost of
products and services sold totaled $4.2 billion in 2011, an increase of approximately $597 million which
is primarily due to volume, material inflation, the phenol plant acquisition and continued investment in
growth initiatives.
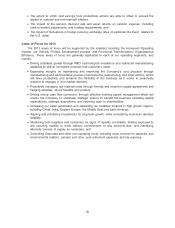
2013 Areas of Focus
Performance Materials and Technologies primary areas of focus for 2013 include:
•Continuing to develop new processes, products and technologies that address energy efficiency,
the environment and security, as well as position the portfolio for higher value;
•Commercializing new products and technologies in the petrochemical, gas processing and
refining industries and renewable energy sector;
•Investing to increase plant capacity and reliability to service backlog and improve productivity
and quality through operational excellence;
•Driving sales and marketing excellence and expanding local presence in high growth regions;
•Managing exposure to raw material price and supply fluctuations through evaluation of
alternative sources of supply and contractual arrangements; and
•Managing the successful integration of acquisitions related to our gas processing and hydrogen
business unit including capacity and geographic expansion to address rapidly growing
commercial opportunities and existing backlog.
Transportation Systems
Overview
Transportation Systems provides automotive products that improve the performance and
efficiency of cars, trucks, and other vehicles through state-of-the-art technologies, world class brands
and global solutions to customers’ needs. Transportation Systems’ products include turbochargers and
thermal systems; and friction materials (Bendix(R) and Jurid(R)) and brake hard parts. Transportation
Systems sells its products to original equipment (“OE”) automotive and truck manufacturers
(e.g., BMW, Caterpillar, Daimler, Renault, Ford, and Volkswagen), wholesalers and distributors and
through the retail aftermarket.
Economic and Other Factors
Transportation Systems operating results are principally impacted by:
•Financial strength and stability of automotive OE manufacturers;
•Global demand, particularly in Western Europe, for automobile and truck production;
•Turbo penetration rates for new engine platforms;
•Global consumer preferences, particularly in Western Europe, for boosted diesel passenger
cars;
•Degree of volatility in raw material prices, including nickel and steel;
•New automobile production rates and the impact of inventory levels of automotive OE
manufacturers on demand for our products;
•Regulations mandating lower emissions and improved fuel economy;
40