Honeywell 2012 Annual Report Download - page 50
Download and view the complete annual report
Please find page 50 of the 2012 Honeywell annual report below. You can navigate through the pages in the report by either clicking on the pages listed below, or by using the keyword search tool below to find specific information within the annual report.-
 1
1 -
2
-
3
-
4
-
5
-
6
-
7
-
8
-
9
-
10
-
11
-
12
-
13
-
14
-
15
-
16
-
17
-
18
-
19
-
20
-
21
-
22
-
23
-
24
-
25
-
26
-
27
-
28
-
29
-
30
-
31
-
32
-
33
-
34
-
35
-
36
-
37
-
38
-
39
-
 40
40 -
 41
41 -
 42
42 -
 43
43 -
 44
44 -
 45
45 -
 46
46 -
 47
47 -
 48
48 -
 49
49 -
 50
50 -
 51
51 -
 52
52 -
 53
53 -
 54
54 -
 55
55 -
 56
56 -
 57
57 -
 58
58 -
 59
59 -
 60
60 -
61
-
62
-
63
-
64
-
65
-
66
-
67
-
68
-
69
-
70
-
71
-
72
-
73
-
74
-
75
-
76
-
77
-
78
-
79
-
80
-
81
-
82
-
83
-
84
-
85
-
86
-
87
-
88
-
89
-
90
-
91
-
92
-
93
-
94
-
95
-
96
-
97
-
98
-
99
-
100
-
101
-
102
-
103
-
104
-
105
-
106
-
107
-
108
-
109
-
110
-
111
-
112
-
113
-
114
-
115
-
116
-
117
-
118
-
119
-
120
-
121
-
122
-
123
-
124
-
125
-
126
-
127
-
128
-
129
-
130
-
131
-
132
-
133
-
134
-
135
-
136
-
137
-
138
-
139
-
140
-
141
 |
 |

•Consumers’ ability to obtain financing for new vehicle purchases; and
•Impact of factors such as consumer confidence on automotive aftermarket demand.
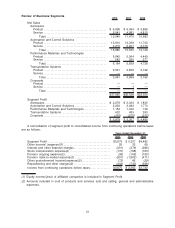
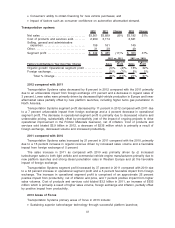
Transportation systems
2012 2011 Change 2010 Change
Net sales . . . . . . . . . . . . . . . . . . . . . . . . . . . . . . . . . $3,561 $3,859 (8)% $3,192 21%
Cost of products and services sold . . . . . . . . . 2,939 3,174 2,641
Selling, general and administrative
expenses . . . . . . . . . . . . . . . . . . . . . . . . . . . . . . . 159 161 149
Other . . . . . . . . . . . . . . . . . . . . . . . . . . . . . . . . . . . . . 31 39 49
Segment profit . . . . . . . . . . . . . . . . . . . . . . . . . . . . $ 432 $ 485 (11)% $ 353 37%
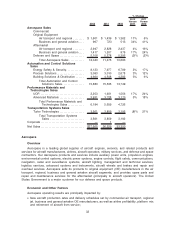
Factors Contributing to Year-Over-Year Change Sales
Segment
Profit Sales
Segment
Profit
2012 vs. 2011 2011 vs. 2010
Organic growth/ Operational segment profit . . . . . . . . . . . . . (3)% (4)% 16% 32%
Foreign exchange. . . . . . . . . . . . . . . . . . . . . . . . . . . . . . . . . . . . . . (5)% (7)% 5% 5%
Total % Change . . . . . . . . . . . . . . . . . . . . . . . . . . . . . . . . . . . (8)% (11)% 21% 37%
2012 compared with 2011
Transportation Systems sales decreased by 8 percent in 2012 compared with the 2011 primarily
due to an unfavorable impact from foreign exchange of 5 percent and a decrease in organic sales of
3 percent. Lower sales were primarily driven by decreased light vehicle production in Europe and lower
aftermarket sales partially offset by new platform launches, including higher turbo gas penetration in
North America.
Transportation Systems segment profit decreased by 11 percent in 2012 compared with 2011 due
to a 7 percent unfavorable impact from foreign exchange and a 4 percent decrease in operational
segment profit. The decrease in operational segment profit is primarily due to decreased volume and
unfavorable pricing, substantially offset by productivity (net of the impact of ongoing projects to drive
operational improvement in the Friction Materials business), net of inflation. Cost of products and
services sold totaled $2.9 billion in 2012, a decrease of $235 million which is primarily a result of
foreign exchange, decreased volume and increased productivity.
2011 compared with 2010
Transportation Systems sales increased by 21 percent in 2011 compared with the 2010, primarily
due to a 16 percent increase in organic revenue driven by increased sales volume and a favorable
impact from foreign exchange of 5 percent.
The sales increase in 2011 as compared with 2010 was primarily driven by (i) increased
turbocharger sales to both light vehicle and commercial vehicle engine manufacturers primarily due to
new platform launches and strong diesel penetration rates in Western Europe and (ii) the favorable
impact of foreign exchange.
Transportation Systems segment profit increased by 37 percent in 2011 compared with 2010 due
to a 32 percent increase in operational segment profit and a 5 percent favorable impact from foreign
exchange. The increase in operational segment profit is comprised of an approximate 25 percent
positive impact from productivity, net of inflation and price, and 7 percent positive impact from higher
sales volumes. Cost of products and services sold totaled $3.2 billion in 2011, an increase of $533
million which is primarily a result of higher sales volume, foreign exchange and inflation, partially offset
by positive impact from productivity.
2013 Areas of Focus
Transportation Systems primary areas of focus in 2013 include:
•Sustaining superior turbocharger technology through successful platform launches;
41