Honeywell 2012 Annual Report Download - page 85
Download and view the complete annual report
Please find page 85 of the 2012 Honeywell annual report below. You can navigate through the pages in the report by either clicking on the pages listed below, or by using the keyword search tool below to find specific information within the annual report.-
 1
1 -
2
-
3
-
4
-
5
-
6
-
7
-
8
-
9
-
10
-
11
-
12
-
13
-
14
-
15
-
16
-
17
-
18
-
19
-
20
-
21
-
22
-
23
-
24
-
25
-
26
-
27
-
28
-
29
-
30
-
31
-
32
-
33
-
34
-
35
-
36
-
37
-
38
-
39
-
40
-
41
-
42
-
43
-
44
-
45
-
46
-
47
-
48
-
49
-
50
-
51
-
52
-
53
-
54
-
55
-
56
-
57
-
58
-
59
-
60
-
61
-
62
-
63
-
64
-
65
-
66
-
67
-
68
-
69
-
70
-
71
-
72
-
73
-
74
-
 75
75 -
 76
76 -
 77
77 -
 78
78 -
 79
79 -
 80
80 -
 81
81 -
 82
82 -
 83
83 -
 84
84 -
 85
85 -
 86
86 -
 87
87 -
 88
88 -
 89
89 -
 90
90 -
 91
91 -
 92
92 -
 93
93 -
 94
94 -
 95
95 -
96
-
97
-
98
-
99
-
100
-
101
-
102
-
103
-
104
-
105
-
106
-
107
-
108
-
109
-
110
-
111
-
112
-
113
-
114
-
115
-
116
-
117
-
118
-
119
-
120
-
121
-
122
-
123
-
124
-
125
-
126
-
127
-
128
-
129
-
130
-
131
-
132
-
133
-
134
-
135
-
136
-
137
-
138
-
139
-
140
-
141
 |
 |

2012 2011 2010
Years Ended December 31,
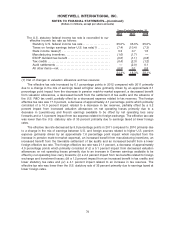
The U.S. statutory federal income tax rate is reconciled to our
effective income tax rate as follows:
Statutory U.S. federal income tax rate . . . . . . . . . . . . . . . . . . . . 35.0% 35.0% 35.0%
Taxes on foreign earnings below U.S. tax rate(1) . . . . . . . . . (7.4) (10.4) (7.3)
State income taxes(1) . . . . . . . . . . . . . . . . . . . . . . . . . . . . . . . . . . . 0.3 0.7 1.5
Manufacturing incentives . . . . . . . . . . . . . . . . . . . . . . . . . . . . . . . . . (1.6) (1.7) —
ESOP dividend tax benefit . . . . . . . . . . . . . . . . . . . . . . . . . . . . . . . (0.6) (1.1) (0.8)
Tax credits . . . . . . . . . . . . . . . . . . . . . . . . . . . . . . . . . . . . . . . . . . . . . . (0.4) (2.3) (1.2)
Audit settlements . . . . . . . . . . . . . . . . . . . . . . . . . . . . . . . . . . . . . . . . — (2.0) 0.1
All other items—net. . . . . . . . . . . . . . . . . . . . . . . . . . . . . . . . . . . . . . (0.9) 0.1 0.8
24.4% 18.3% 28.1%
(1) Net of changes in valuation allowance and tax reserves
The effective tax rate increased by 6.1 percentage points in 2012 compared with 2011 primarily
due to a change in the mix of earnings taxed at higher rates (primarily driven by an approximate 6.1
percentage point impact from the decrease in pension mark-to-market expense), a decreased benefit
from valuation allowances, a decreased benefit from the settlement of tax audits and the absence of
the U.S. R&D tax credit, partially offset by a decreased expense related to tax reserves. The foreign
effective tax rate was 17.0 percent, a decrease of approximately 4.1 percentage points which primarily
consisted of a 10.0 percent impact related to a decrease in tax reserves, partially offset by a 5.2
percent impact from increased valuation allowances on net operating losses primarily due to a
decrease in Luxembourg and French earnings available to be offset by net operating loss carry
forwards and a 1.4 percent impact from tax expense related to foreign exchange. The effective tax rate
was lower than the U.S. statutory rate of 35 percent primarily due to earnings taxed at lower foreign
rates.
The effective tax rate decreased by 9.8 percentage points in 2011 compared to 2010 primarily due
to a change in the mix of earnings between U.S. and foreign sources related to higher U.S. pension
expense (primarily driven by an approximate 7.6 percentage point impact which resulted from the
increase in pension mark-to-market expense), an increased benefit from manufacturing incentives, an
increased benefit from the favorable settlement of tax audits and an increased benefit from a lower
foreign effective tax rate. The foreign effective tax rate was 21.1 percent, a decrease of approximately
4.9 percentage points which primarily consisted of (i) a 5.1 percent impact from decreased valuation
allowances on net operating losses primarily due to an increase in German earnings available to be
offset by net operating loss carry forwards; (ii) a 2.4 percent impact from tax benefits related to foreign
exchange and investment losses; (iii) a 1.2 percent impact from an increased benefit in tax credits and
lower statutory tax rates and (iv) a 4.1 percent impact related to an increase in tax reserves. The
effective tax rate was lower than the U.S. statutory rate of 35 percent primarily due to earnings taxed at
lower foreign rates.
76
HONEYWELL INTERNATIONAL INC.
NOTES TO FINANCIAL STATEMENTS—(Continued)
(Dollars in millions, except per share amounts)