Honeywell 2012 Annual Report Download - page 16
Download and view the complete annual report
Please find page 16 of the 2012 Honeywell annual report below. You can navigate through the pages in the report by either clicking on the pages listed below, or by using the keyword search tool below to find specific information within the annual report.-
 1
1 -
2
-
3
-
4
-
5
-
 6
6 -
 7
7 -
 8
8 -
 9
9 -
 10
10 -
 11
11 -
 12
12 -
 13
13 -
 14
14 -
 15
15 -
 16
16 -
 17
17 -
 18
18 -
 19
19 -
 20
20 -
 21
21 -
 22
22 -
 23
23 -
 24
24 -
 25
25 -
 26
26 -
27
-
28
-
29
-
30
-
31
-
32
-
33
-
34
-
35
-
36
-
37
-
38
-
39
-
40
-
41
-
42
-
43
-
44
-
45
-
46
-
47
-
48
-
49
-
50
-
51
-
52
-
53
-
54
-
55
-
56
-
57
-
58
-
59
-
60
-
61
-
62
-
63
-
64
-
65
-
66
-
67
-
68
-
69
-
70
-
71
-
72
-
73
-
74
-
75
-
76
-
77
-
78
-
79
-
80
-
81
-
82
-
83
-
84
-
85
-
86
-
87
-
88
-
89
-
90
-
91
-
92
-
93
-
94
-
95
-
96
-
97
-
98
-
99
-
100
-
101
-
102
-
103
-
104
-
105
-
106
-
107
-
108
-
109
-
110
-
111
-
112
-
113
-
114
-
115
-
116
-
117
-
118
-
119
-
120
-
121
-
122
-
123
-
124
-
125
-
126
-
127
-
128
-
129
-
130
-
131
-
132
-
133
-
134
-
135
-
136
-
137
-
138
-
139
-
140
-
141
 |
 |

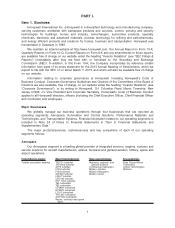
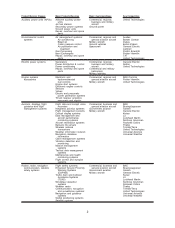
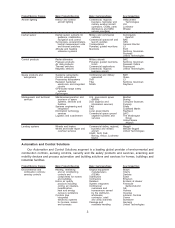
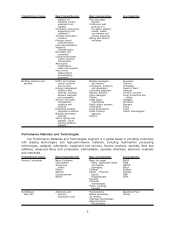
Product/Service Classes Major Products/Services Major Customers/Uses Key Competitors
Renewable fuels and
chemicals
Technology licensing of
Process, catalysts,
absorbents,
Refining equipment and
services for producing
renewable-based fuels
and chemicals
Military, refining, fuel oil,
power production
Dynamotive
Haldor Topsoe
Kior
Lurgi
Neste Oy
Syntroleum
Gas processing and
hydrogen
Design, engineer,
manufacture and install
natural gas processing
and hydrogen separation
plants
Gas processing and
hydrogen separation
Cameron
Exterran
Linde AG
Lurgi
Optimized Process Design
Proquip
Prosep
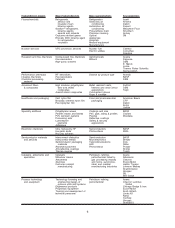
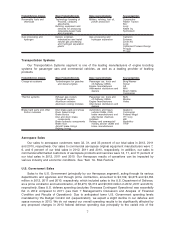
Transportation Systems
Our Transportation Systems segment is one of the leading manufacturers of engine boosting
systems for passenger cars and commercial vehicles, as well as a leading provider of braking
products.
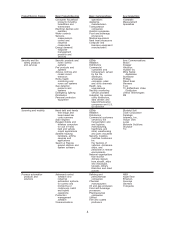
Product/Service Classes Major Products/Services Major Customers/Uses Key Competitors
Charge-air systems Turbochargers for gasoline
and diesel engines
Passenger car, truck and
off-highway OEMs
Engine manufacturers
Aftermarket distributors and
dealers
Borg-Warner
Holset
IHI
MHI
Bosch Mahle
Continental
Thermal systems Exhaust gas coolers
Charge-air coolers
Aluminum radiators
Aluminum cooling modules
Passenger car, truck and
off-highway OEMs
Engine manufacturers
Aftermarket distributors and
dealers
Behr
Modine
Valeo
Brake hard parts and other
friction materials
Disc brake pads and shoes
Drum brake linings
Brake blocks
Disc and drum brake
components
Brake hydraulic components
Brake fluid
Aircraft brake linings
Railway linings
Automotive and heavy
vehicle OEMs, OES,
brake manufacturers and
aftermarket channels
Installers
Railway and commercial/
military aircraft OEMs and
brake manufacturers
Akebono
Continental
Federal-Mogul
ITT Corp
JBI
Nisshinbo
TRW
Aerospace Sales
Our sales to aerospace customers were 32, 31, and 33 percent of our total sales in 2012, 2011
and 2010, respectively. Our sales to commercial aerospace original equipment manufacturers were 7,
6, and 6 percent of our total sales in 2012, 2011 and 2010, respectively. In addition, our sales to
commercial aftermarket customers of aerospace products and services were 12, 11, and 11 percent of
our total sales in 2012, 2011 and 2010. Our Aerospace results of operations can be impacted by
various industry and economic conditions. See “Item 1A. Risk Factors.”
U.S. Government Sales
Sales to the U.S. Government (principally by our Aerospace segment), acting through its various
departments and agencies and through prime contractors, amounted to $4,109, $4,276 and $4,354
million in 2012, 2011 and 2010, respectively, which included sales to the U.S. Department of Defense,
as a prime contractor and subcontractor, of $3,273, $3,374 and $3,500 million in 2012, 2011 and 2010,
respectively. Base U.S. defense spending (excludes Overseas Contingent Operations) was essentially
flat in 2012 compared to 2011 (see Item 7 Management’s Discussion and Analysis of Financial
Condition and Results of Operations). Due to anticipated lower U.S. Government spending levels
mandated by the Budget Control Act (sequestration), we expect a slight decline in our defense and
space revenue in 2013. We do not expect our overall operating results to be significantly affected by
any proposed changes in 2013 federal defense spending due principally to the varied mix of the
7