Honeywell 2012 Annual Report Download - page 45
Download and view the complete annual report
Please find page 45 of the 2012 Honeywell annual report below. You can navigate through the pages in the report by either clicking on the pages listed below, or by using the keyword search tool below to find specific information within the annual report.-
 1
1 -
2
-
3
-
4
-
5
-
6
-
7
-
8
-
9
-
10
-
11
-
12
-
13
-
14
-
15
-
16
-
17
-
18
-
19
-
20
-
21
-
22
-
23
-
24
-
25
-
26
-
27
-
28
-
29
-
30
-
31
-
32
-
33
-
34
-
 35
35 -
 36
36 -
 37
37 -
 38
38 -
 39
39 -
 40
40 -
 41
41 -
 42
42 -
 43
43 -
 44
44 -
 45
45 -
 46
46 -
 47
47 -
 48
48 -
 49
49 -
 50
50 -
 51
51 -
 52
52 -
 53
53 -
 54
54 -
 55
55 -
56
-
57
-
58
-
59
-
60
-
61
-
62
-
63
-
64
-
65
-
66
-
67
-
68
-
69
-
70
-
71
-
72
-
73
-
74
-
75
-
76
-
77
-
78
-
79
-
80
-
81
-
82
-
83
-
84
-
85
-
86
-
87
-
88
-
89
-
90
-
91
-
92
-
93
-
94
-
95
-
96
-
97
-
98
-
99
-
100
-
101
-
102
-
103
-
104
-
105
-
106
-
107
-
108
-
109
-
110
-
111
-
112
-
113
-
114
-
115
-
116
-
117
-
118
-
119
-
120
-
121
-
122
-
123
-
124
-
125
-
126
-
127
-
128
-
129
-
130
-
131
-
132
-
133
-
134
-
135
-
136
-
137
-
138
-
139
-
140
-
141
 |
 |

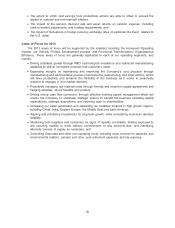
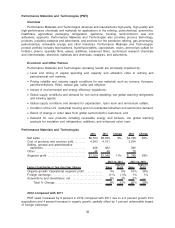
•The strength of global capital and operating spending on process (including petrochemical and
refining) and building automation;
•Inventory levels in distribution channels; and
•Changes to energy, fire, security, health care, safety and environmental concerns and
regulations.
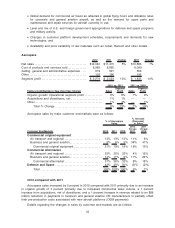
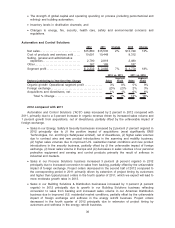
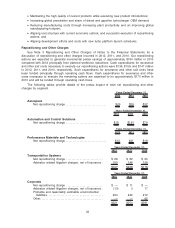
Automation and Control Solutions
2012 2011 Change 2010 Change
Net sales . . . . . . . . . . . . . . . . . . . . . . . . . . . . . . $15,880 $15,535 2% $13,749 13%
Cost of products and services sold . . . . . 10,691 10,448 9,312
Selling, general and administrative
expenses. . . . . . . . . . . . . . . . . . . . . . . . . . . . 2,790 2,819 2,480
Other. . . . . . . . . . . . . . . . . . . . . . . . . . . . . . . . . . 167 185 187
Segment profit . . . . . . . . . . . . . . . . . . . . . . . . . $ 2,232 $ 2,083 7% $ 1,770 18%
Factors Contributing to Year-Over-Year Change Sales
Segment
Profit Sales
Segment
Profit
2012 vs. 2011 2011 vs. 2010
Organic growth/ Operational segment profit . . . . . . . . . . . . . 3% 8% 5% 9%
Foreign exchange. . . . . . . . . . . . . . . . . . . . . . . . . . . . . . . . . . . . . . (2)% (2)% 2% 3%
Acquisitions and divestitures, net . . . . . . . . . . . . . . . . . . . . . . . 1% 1% 6% 6%
Total % Change . . . . . . . . . . . . . . . . . . . . . . . . . . . . . . . . . . . 2% 7% 13% 18%
2012 compared with 2011
Automation and Control Solutions (“ACS”) sales increased by 2 percent in 2012 compared with
2011, primarily due to a 3 percent increase in organic revenue driven by increased sales volume and
1 percent growth from acquisitions, net of divestitures, partially offset by the unfavorable impact of
foreign exchange.
•Sales in our Energy, Safety & Security businesses increased by 2 percent (1 percent organic) in
2012 principally due to (i) the positive impact of acquisitions (most significantly EMS
Technologies, Inc. and King’s Safetywear Limited), net of divestitures, (ii) higher sales volumes
due to contract wins and new product introductions in the scanning and mobility business,
(iii) higher sales volumes due to improved U.S. residential market conditions and new product
introductions in the security business, partially offset by (i) the unfavorable impact of foreign
exchange, (ii) lower sales volume in Europe and (iii) decreases in sales volumes of our personal
protective equipment and sensing and control products primarily the result of softness in
industrial end markets.
•Sales in our Process Solutions business increased 3 percent (6 percent organic) in 2012
principally due to increased conversion to sales from backlog, partially offset by the unfavorable
impact of foreign exchange. Project orders decreased in the second half of 2012 compared to
the corresponding period in 2011 primarily driven by extension of project timing by customers
and higher than typical project orders in the fourth quarter of 2011, which we expect will lead to
more moderate growth rates in 2013.
•Sales in our Building Solutions & Distribution businesses increased by 3 percent (4 percent
organic) in 2012 principally due to growth in our Building Solutions business reflecting
conversion to sales from backlog and increased sales volume in our Americas Distribution
business due to improved U.S. residential market conditions, partially offset by the unfavorable
impact of foreign exchange and softness in the energy retrofit business. Project orders
decreased in the fourth quarter of 2012 principally due to extension of project timing by
customers and softness in the energy retrofit business.
36