Honeywell 2012 Annual Report Download - page 43
Download and view the complete annual report
Please find page 43 of the 2012 Honeywell annual report below. You can navigate through the pages in the report by either clicking on the pages listed below, or by using the keyword search tool below to find specific information within the annual report.-
 1
1 -
2
-
3
-
4
-
5
-
6
-
7
-
8
-
9
-
10
-
11
-
12
-
13
-
14
-
15
-
16
-
17
-
18
-
19
-
20
-
21
-
22
-
23
-
24
-
25
-
26
-
27
-
28
-
29
-
30
-
31
-
32
-
 33
33 -
 34
34 -
 35
35 -
 36
36 -
 37
37 -
 38
38 -
 39
39 -
 40
40 -
 41
41 -
 42
42 -
 43
43 -
 44
44 -
 45
45 -
 46
46 -
 47
47 -
 48
48 -
 49
49 -
 50
50 -
 51
51 -
 52
52 -
 53
53 -
54
-
55
-
56
-
57
-
58
-
59
-
60
-
61
-
62
-
63
-
64
-
65
-
66
-
67
-
68
-
69
-
70
-
71
-
72
-
73
-
74
-
75
-
76
-
77
-
78
-
79
-
80
-
81
-
82
-
83
-
84
-
85
-
86
-
87
-
88
-
89
-
90
-
91
-
92
-
93
-
94
-
95
-
96
-
97
-
98
-
99
-
100
-
101
-
102
-
103
-
104
-
105
-
106
-
107
-
108
-
109
-
110
-
111
-
112
-
113
-
114
-
115
-
116
-
117
-
118
-
119
-
120
-
121
-
122
-
123
-
124
-
125
-
126
-
127
-
128
-
129
-
130
-
131
-
132
-
133
-
134
-
135
-
136
-
137
-
138
-
139
-
140
-
141
 |
 |
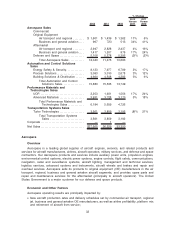
Commercial original equipment (OE) sales increased by 19 percent (12 percent organic) in 2012
compared to 2011.
•Air transport and regional OE sales increased by 11 percent (11 percent organic) in 2012
primarily driven by higher sales to our OE customers, consistent with higher production rates,
and a favorable platform mix.
•Business and general aviation OE sales increased by 34 percent (15 percent organic) in 2012
driven by strong demand in the business jet end-market, favorable platform mix, growth from
acquisitions and the favorable 12 percent impact of the OEM payments discussed above.
Commercial aftermarket sales increased by 8 percent in 2012 compared to 2011.
•Air transport and regional aftermarket sales increased by 4 percent for 2012 primarily due to
increased sales of spare parts and higher maintenance activity driven by an approximate
2 percent increase in global flying hours in 2012, increased sales of avionics upgrades, and
changes in customer buying patterns relating to maintenance activity in the first half of 2012.
•Business and general aviation aftermarket sales increased by 17 percent in 2012 primarily due
to increased sales of spare parts and revenue associated with maintenance service agreements
and a higher penetration in retrofit, modifications, and upgrades.
Defense and space sales decreased by 3 percent (negative 4 percent organic) in 2012 primarily
due to anticipated program ramp downs, partially offset by higher international aftermarket sales
and growth from acquisitions, net of divestitures.
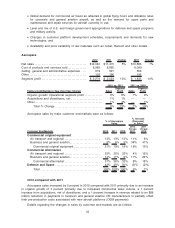
Aerospace segment profit increased by 13 percent in 2012 compared with 2011 primarily due to
an increase in operational segment profit of 8 percent, a 4 percent favorable impact from lower OEM
payments, discussed above, and a 1 percent increase from acquisitions, net of divestitures. The
increase in operational segment profit is due to the favorable impact from higher price and productivity,
net of inflation, and commercial demand partially offset by increased research, development and
engineering investments. Cost of products and services sold totaled $9.0 billion in 2012, an increase of
approximately $324 million from 2011 which is primarily a result of the factors discussed above
(excluding price).
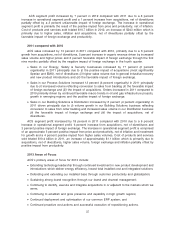
2011 compared with 2010
Aerospace sales increased by 7 percent in 2011 compared with 2010 primarily due to an increase
in organic growth of 7 percent primarily due to increased commercial sales volume.
Details regarding the increase in sales by customer end-markets are as follows:
Commercial OE sales increased by 15 percent (11 percent organic) in 2011 compared with 2010.
•Air transport and regional OE sales increased by 6 percent in 2011 primarily driven by higher
sales to our OE customers, consistent with higher production rates, platform mix and a higher
win rate on selectables (components selected by purchasers of new aircraft).
•Business and general aviation OE sales increased by 41 percent (24 percent organic) in 2011
due to a rebound from near trough levels in 2010 and strong demand in the business jet end
market, favorable platform mix, growth from acquisitions and lower OEM Payments during 2011.
Commercial aftermarket sales increased by 18 percent in 2011 compared to 2010.
•Air transport and regional aftermarket sales increased by 16 percent in 2011 primarily due to
(i) increased maintenance activity and spare parts sales driven by an approximately 6 percent
increase in global flying hours, (ii) increased sales of avionics upgrades, and (iii) changes in
customer buying patterns relating to spare parts and maintenance activity.
•Business and general aviation aftermarket sales increased by 24 percent in 2011 primarily due
to increased sales of spare parts and revenue associated with maintenance service
agreements.
Defense and space sales decreased by 2 percent (negative 3 percent organic) in 2011 primarily
due to anticipated program ramp downs, partially offset by higher domestic and international
34