Honeywell 2012 Annual Report Download - page 66
Download and view the complete annual report
Please find page 66 of the 2012 Honeywell annual report below. You can navigate through the pages in the report by either clicking on the pages listed below, or by using the keyword search tool below to find specific information within the annual report.-
 1
1 -
2
-
3
-
4
-
5
-
6
-
7
-
8
-
9
-
10
-
11
-
12
-
13
-
14
-
15
-
16
-
17
-
18
-
19
-
20
-
21
-
22
-
23
-
24
-
25
-
26
-
27
-
28
-
29
-
30
-
31
-
32
-
33
-
34
-
35
-
36
-
37
-
38
-
39
-
40
-
41
-
42
-
43
-
44
-
45
-
46
-
47
-
48
-
49
-
50
-
51
-
52
-
53
-
54
-
55
-
 56
56 -
 57
57 -
 58
58 -
 59
59 -
 60
60 -
 61
61 -
 62
62 -
 63
63 -
 64
64 -
 65
65 -
 66
66 -
 67
67 -
 68
68 -
 69
69 -
 70
70 -
 71
71 -
 72
72 -
 73
73 -
 74
74 -
 75
75 -
 76
76 -
77
-
78
-
79
-
80
-
81
-
82
-
83
-
84
-
85
-
86
-
87
-
88
-
89
-
90
-
91
-
92
-
93
-
94
-
95
-
96
-
97
-
98
-
99
-
100
-
101
-
102
-
103
-
104
-
105
-
106
-
107
-
108
-
109
-
110
-
111
-
112
-
113
-
114
-
115
-
116
-
117
-
118
-
119
-
120
-
121
-
122
-
123
-
124
-
125
-
126
-
127
-
128
-
129
-
130
-
131
-
132
-
133
-
134
-
135
-
136
-
137
-
138
-
139
-
140
-
141
 |
 |

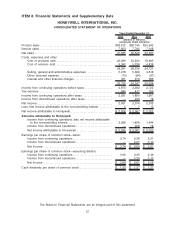
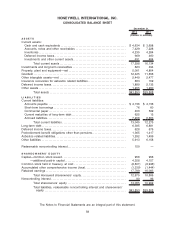
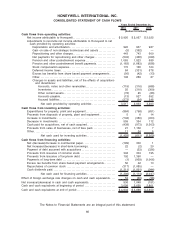
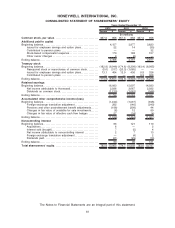
ITEM 8. Financial Statements and Supplementary Data
HONEYWELL INTERNATIONAL INC.
CONSOLIDATED STATEMENT OF OPERATIONS
2012 2011 2010
Years Ended December 31,
(Dollars in millions,
except per share amounts)
Product sales . . . . . . . . . . . . . . . . . . . . . . . . . . . . . . . . . . . . . . . . . . . . . . . . . . . . . $29,812 $28,745 $25,242
Service sales . . . . . . . . . . . . . . . . . . . . . . . . . . . . . . . . . . . . . . . . . . . . . . . . . . . . . 7,853 7,784 7,108
Net sales . . . . . . . . . . . . . . . . . . . . . . . . . . . . . . . . . . . . . . . . . . . . . . . . . . . . . . . . . 37,665 36,529 32,350
Costs, expenses and other
Cost of products sold . . . . . . . . . . . . . . . . . . . . . . . . . . . . . . . . . . . . . . . . . 22,929 23,220 19,903
Cost of services sold . . . . . . . . . . . . . . . . . . . . . . . . . . . . . . . . . . . . . . . . . . 5,362 5,336 4,818
28,291 28,556 24,721
Selling, general and administrative expenses . . . . . . . . . . . . . . . . . . . 5,218 5,399 4,618
Other (income) expense . . . . . . . . . . . . . . . . . . . . . . . . . . . . . . . . . . . . . . . (70) (84) (97)
Interest and other financial charges . . . . . . . . . . . . . . . . . . . . . . . . . . . . 351 376 386
33,790 34,247 29,628
Income from continuing operations before taxes . . . . . . . . . . . . . . . . . . . . 3,875 2,282 2,722
Tax expense . . . . . . . . . . . . . . . . . . . . . . . . . . . . . . . . . . . . . . . . . . . . . . . . . . . . . . 944 417 765
Income from continuing operations after taxes . . . . . . . . . . . . . . . . . . . . . . 2,931 1,865 1,957
Income from discontinued operations after taxes . . . . . . . . . . . . . . . . . . . . — 209 78
Net income . . . . . . . . . . . . . . . . . . . . . . . . . . . . . . . . . . . . . . . . . . . . . . . . . . . . . . . 2,931 2,074 2,035
Less: Net income attributable to the noncontrolling interest . . . . . . . . . . 5 7 13
Net income attributable to Honeywell . . . . . . . . . . . . . . . . . . . . . . . . . . . . . . . $ 2,926 $ 2,067 $ 2,022
Amounts attributable to Honeywell:
Income from continuing operations less net income attributable
to the noncontrolling interest. . . . . . . . . . . . . . . . . . . . . . . . . . . . . . . . . 2,926 1,858 1,944
Income from discontinued operations. . . . . . . . . . . . . . . . . . . . . . . . . . . — 209 78
Net income attributable to Honeywell. . . . . . . . . . . . . . . . . . . . . . . . . . . $ 2,926 $ 2,067 $ 2,022
Earnings per share of common stock—basic:
Income from continuing operations . . . . . . . . . . . . . . . . . . . . . . . . . . . . . 3.74 2.38 2.51
Income from discontinued operations. . . . . . . . . . . . . . . . . . . . . . . . . . . — 0.27 0.10
Net income . . . . . . . . . . . . . . . . . . . . . . . . . . . . . . . . . . . . . . . . . . . . . . . . . . . $ 3.74 $ 2.65 $ 2.61
Earnings per share of common stock—assuming dilution:
Income from continuing operations . . . . . . . . . . . . . . . . . . . . . . . . . . . . . 3.69 2.35 2.49
Income from discontinued operations. . . . . . . . . . . . . . . . . . . . . . . . . . . — 0.26 0.10
Net income . . . . . . . . . . . . . . . . . . . . . . . . . . . . . . . . . . . . . . . . . . . . . . . . . . . $ 3.69 $ 2.61 $ 2.59
Cash dividends per share of common stock . . . . . . . . . . . . . . . . . . . . . . . . $ 1.53 $ 1.37 $ 1.21
The Notes to Financial Statements are an integral part of this statement.
57