Honeywell 2012 Annual Report Download - page 80
Download and view the complete annual report
Please find page 80 of the 2012 Honeywell annual report below. You can navigate through the pages in the report by either clicking on the pages listed below, or by using the keyword search tool below to find specific information within the annual report.-
 1
1 -
2
-
3
-
4
-
5
-
6
-
7
-
8
-
9
-
10
-
11
-
12
-
13
-
14
-
15
-
16
-
17
-
18
-
19
-
20
-
21
-
22
-
23
-
24
-
25
-
26
-
27
-
28
-
29
-
30
-
31
-
32
-
33
-
34
-
35
-
36
-
37
-
38
-
39
-
40
-
41
-
42
-
43
-
44
-
45
-
46
-
47
-
48
-
49
-
50
-
51
-
52
-
53
-
54
-
55
-
56
-
57
-
58
-
59
-
60
-
61
-
62
-
63
-
64
-
65
-
66
-
67
-
68
-
69
-
 70
70 -
 71
71 -
 72
72 -
 73
73 -
 74
74 -
 75
75 -
 76
76 -
 77
77 -
 78
78 -
 79
79 -
 80
80 -
 81
81 -
 82
82 -
 83
83 -
 84
84 -
 85
85 -
 86
86 -
 87
87 -
 88
88 -
 89
89 -
 90
90 -
91
-
92
-
93
-
94
-
95
-
96
-
97
-
98
-
99
-
100
-
101
-
102
-
103
-
104
-
105
-
106
-
107
-
108
-
109
-
110
-
111
-
112
-
113
-
114
-
115
-
116
-
117
-
118
-
119
-
120
-
121
-
122
-
123
-
124
-
125
-
126
-
127
-
128
-
129
-
130
-
131
-
132
-
133
-
134
-
135
-
136
-
137
-
138
-
139
-
140
-
141
 |
 |

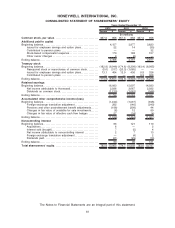
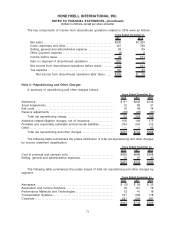
The key components of income from discontinued operations related to CPG were as follows:
2011 2010
Years Ended December 31,
Net sales. . . . . . . . . . . . . . . . . . . . . . . . . . . . . . . . . . . . . . . . . . . . . . . . . . . $530 $1,020
Costs, expenses and other. . . . . . . . . . . . . . . . . . . . . . . . . . . . . . . . . . 421 798
Selling, general and administrative expense. . . . . . . . . . . . . . . . . . 63 99
Other (income) expense . . . . . . . . . . . . . . . . . . . . . . . . . . . . . . . . . . . . (2) 2
Income before taxes . . . . . . . . . . . . . . . . . . . . . . . . . . . . . . . . . . . . . . . . 48 121
Gain on disposal of discontinued operations . . . . . . . . . . . . . . . . . 301 —
Net income from discontinued operations before taxes . . . . . . . 349 121
Tax expense . . . . . . . . . . . . . . . . . . . . . . . . . . . . . . . . . . . . . . . . . . . . . . . 140 43
Net income from discontinued operations after taxes . . . . . $209 $ 78
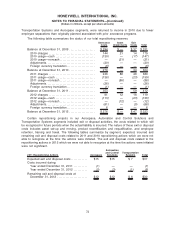
Note 3—Repositioning and Other Charges
A summary of repositioning and other charges follows:
2012 2011 2010
Years Ended December 31,
Severance . . . . . . . . . . . . . . . . . . . . . . . . . . . . . . . . . . . . . . . . . . . . . . . . . . . . . . . . . $ 91 $246 $144
Asset impairments . . . . . . . . . . . . . . . . . . . . . . . . . . . . . . . . . . . . . . . . . . . . . . . . . . 12 86 21
Exit costs . . . . . . . . . . . . . . . . . . . . . . . . . . . . . . . . . . . . . . . . . . . . . . . . . . . . . . . . . . 16 48 14
Reserve adjustments . . . . . . . . . . . . . . . . . . . . . . . . . . . . . . . . . . . . . . . . . . . . . . . (66) (26) (30)
Total net repositioning charge. . . . . . . . . . . . . . . . . . . . . . . . . . . . . . . . . . . 53 354 149
Asbestos related litigation charges, net of insurance. . . . . . . . . . . . . . . . . . 156 149 175
Probable and reasonably estimable environmental liabilities. . . . . . . . . . . 234 240 212
Other .............................................................. — — 62
Total net repositioning and other charges. . . . . . . . . . . . . . . . . . . . . . . . $443 $743 $598
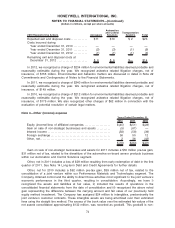
The following table summarizes the pretax distribution of total net repositioning and other charges
by income statement classification:
2012 2011 2010
Years Ended December 31,
Cost of products and services sold . . . . . . . . . . . . . . . . . . . . . . . . . . . . . . . . . . $428 $646 $558
Selling, general and administrative expenses. . . . . . . . . . . . . . . . . . . . . . . . . 15 97 40
$443 $743 $598
The following table summarizes the pretax impact of total net repositioning and other charges by
segment:
2012 2011 2010
Years Ended December 31,
Aerospace . . . . . . . . . . . . . . . . . . . . . . . . . . . . . . . . . . . . . . . . . . . . . . . . . . . . . . . . . $ (5) $ 29 $ 32
Automation and Control Solutions . . . . . . . . . . . . . . . . . . . . . . . . . . . . . . . . . . . 18 191 79
Performance Materials and Technologies . . . . . . . . . . . . . . . . . . . . . . . . . . . . 12 41 18
Transportation Systems . . . . . . . . . . . . . . . . . . . . . . . . . . . . . . . . . . . . . . . . . . . . . 197 228 178
Corporate . . . . . . . . . . . . . . . . . . . . . . . . . . . . . . . . . . . . . . . . . . . . . . . . . . . . . . . . . . 221 254 291
$443 $743 $598
71
HONEYWELL INTERNATIONAL INC.
NOTES TO FINANCIAL STATEMENTS—(Continued)
(Dollars in millions, except per share amounts)