Honeywell 2012 Annual Report Download - page 119
Download and view the complete annual report
Please find page 119 of the 2012 Honeywell annual report below. You can navigate through the pages in the report by either clicking on the pages listed below, or by using the keyword search tool below to find specific information within the annual report.-
 1
1 -
2
-
3
-
4
-
5
-
6
-
7
-
8
-
9
-
10
-
11
-
12
-
13
-
14
-
15
-
16
-
17
-
18
-
19
-
20
-
21
-
22
-
23
-
24
-
25
-
26
-
27
-
28
-
29
-
30
-
31
-
32
-
33
-
34
-
35
-
36
-
37
-
38
-
39
-
40
-
41
-
42
-
43
-
44
-
45
-
46
-
47
-
48
-
49
-
50
-
51
-
52
-
53
-
54
-
55
-
56
-
57
-
58
-
59
-
60
-
61
-
62
-
63
-
64
-
65
-
66
-
67
-
68
-
69
-
70
-
71
-
72
-
73
-
74
-
75
-
76
-
77
-
78
-
79
-
80
-
81
-
82
-
83
-
84
-
85
-
86
-
87
-
88
-
89
-
90
-
91
-
92
-
93
-
94
-
95
-
96
-
97
-
98
-
99
-
100
-
101
-
102
-
103
-
104
-
105
-
106
-
107
-
108
-
 109
109 -
 110
110 -
 111
111 -
 112
112 -
 113
113 -
 114
114 -
 115
115 -
 116
116 -
 117
117 -
 118
118 -
 119
119 -
 120
120 -
 121
121 -
 122
122 -
 123
123 -
 124
124 -
 125
125 -
 126
126 -
 127
127 -
 128
128 -
 129
129 -
130
-
131
-
132
-
133
-
134
-
135
-
136
-
137
-
138
-
139
-
140
-
141
 |
 |

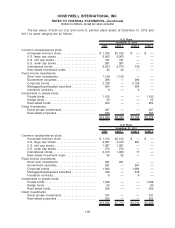
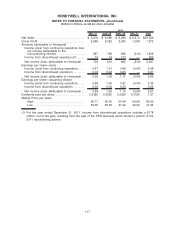
Total Level 1 Level 2 Level 3
December 31, 2012
Non-U.S. Plans
Common stock/preferred stock:
U.S. companies . . . . . . . . . . . . . . . . . . . . . . . . . . . . . . . . . . . . . $ 366 $316 $ 50 $ —
Non-U.S. companies. . . . . . . . . . . . . . . . . . . . . . . . . . . . . . . . . 1,605 176 1,429 —
Fixed income investments:
Short-term investments . . . . . . . . . . . . . . . . . . . . . . . . . . . . . . 104 104 — —
Government securities . . . . . . . . . . . . . . . . . . . . . . . . . . . . . . . 1,321 — 1,321 —
Corporate bonds. . . . . . . . . . . . . . . . . . . . . . . . . . . . . . . . . . . . . 571 — 571 —
Mortgage/Asset-backed securities . . . . . . . . . . . . . . . . . . . . 8 — 8 —
Insurance contracts. . . . . . . . . . . . . . . . . . . . . . . . . . . . . . . . . . 203 — 203 —
Investments in private funds:
Private funds . . . . . . . . . . . . . . . . . . . . . . . . . . . . . . . . . . . . . . . . 136 — — 136
Hedge funds . . . . . . . . . . . . . . . . . . . . . . . . . . . . . . . . . . . . . . . . 56 — — 56
Real estate funds. . . . . . . . . . . . . . . . . . . . . . . . . . . . . . . . . . . . 157 — — 157
$4,527 $596 $3,582 $349
Total Level 1 Level 2 Level 3
December 31, 2011
Non-U.S. Plans
Common stock/preferred stock:
U.S. companies . . . . . . . . . . . . . . . . . . . . . . . . . . . . . . . . . . . . . $ 371 $249 $ 122 $ —
Non-U.S. companies. . . . . . . . . . . . . . . . . . . . . . . . . . . . . . . . . 1,343 233 1,110 —
Fixed income investments:
Short-term investments . . . . . . . . . . . . . . . . . . . . . . . . . . . . . . 78 78 — —
Government securities . . . . . . . . . . . . . . . . . . . . . . . . . . . . . . . 1,175 — 1,175 —
Corporate bonds. . . . . . . . . . . . . . . . . . . . . . . . . . . . . . . . . . . . . 463 — 463 —
Mortgage/Asset-backed securities . . . . . . . . . . . . . . . . . . . . 5 — 5 —
Insurance contracts. . . . . . . . . . . . . . . . . . . . . . . . . . . . . . . . . . 197 — 197 —
Investments in private funds:
Private funds . . . . . . . . . . . . . . . . . . . . . . . . . . . . . . . . . . . . . . . . 112 — — 112
Hedge funds . . . . . . . . . . . . . . . . . . . . . . . . . . . . . . . . . . . . . . . . 54 — — 54
Real estate funds. . . . . . . . . . . . . . . . . . . . . . . . . . . . . . . . . . . . 160 — — 160
$3,958 $560 $3,072 $326
110
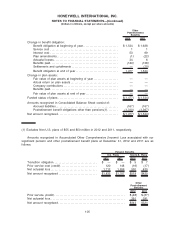
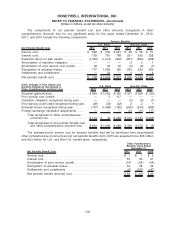
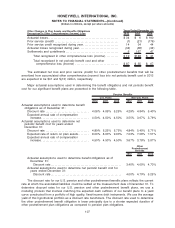
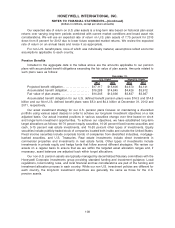
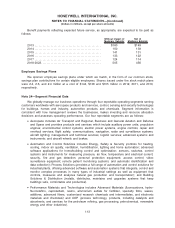
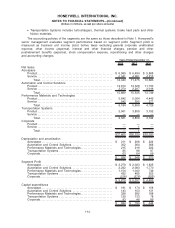
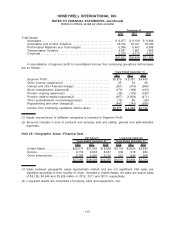
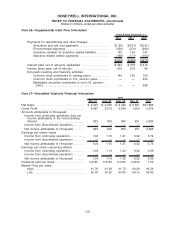
HONEYWELL INTERNATIONAL INC.
NOTES TO FINANCIAL STATEMENTS—(Continued)
(Dollars in millions, except per share amounts)