Honeywell 2012 Annual Report Download - page 48
Download and view the complete annual report
Please find page 48 of the 2012 Honeywell annual report below. You can navigate through the pages in the report by either clicking on the pages listed below, or by using the keyword search tool below to find specific information within the annual report.-
 1
1 -
2
-
3
-
4
-
5
-
6
-
7
-
8
-
9
-
10
-
11
-
12
-
13
-
14
-
15
-
16
-
17
-
18
-
19
-
20
-
21
-
22
-
23
-
24
-
25
-
26
-
27
-
28
-
29
-
30
-
31
-
32
-
33
-
34
-
35
-
36
-
37
-
 38
38 -
 39
39 -
 40
40 -
 41
41 -
 42
42 -
 43
43 -
 44
44 -
 45
45 -
 46
46 -
 47
47 -
 48
48 -
 49
49 -
 50
50 -
 51
51 -
 52
52 -
 53
53 -
 54
54 -
 55
55 -
 56
56 -
 57
57 -
 58
58 -
59
-
60
-
61
-
62
-
63
-
64
-
65
-
66
-
67
-
68
-
69
-
70
-
71
-
72
-
73
-
74
-
75
-
76
-
77
-
78
-
79
-
80
-
81
-
82
-
83
-
84
-
85
-
86
-
87
-
88
-
89
-
90
-
91
-
92
-
93
-
94
-
95
-
96
-
97
-
98
-
99
-
100
-
101
-
102
-
103
-
104
-
105
-
106
-
107
-
108
-
109
-
110
-
111
-
112
-
113
-
114
-
115
-
116
-
117
-
118
-
119
-
120
-
121
-
122
-
123
-
124
-
125
-
126
-
127
-
128
-
129
-
130
-
131
-
132
-
133
-
134
-
135
-
136
-
137
-
138
-
139
-
140
-
141
 |
 |
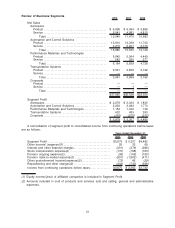
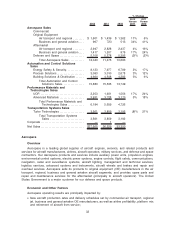
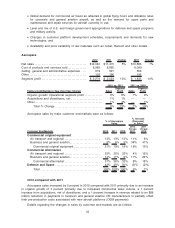
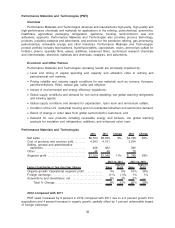
•UOP sales increased by 17 percent (12 percent organic) in 2012 compared to 2011 primarily
driven by (i) increased equipment and licensing revenues and higher volume of petrochemical
and refining catalysts in the first nine months, reflecting continued strength in the refining and
petrochemical industries, and (ii) the favorable impact from acquisitions, partially offset by lower
service revenue related to scheduled project completions.
•Advanced Materials sales increased by 5 percent (flat organic) in 2012 compared to 2011
primarily driven by an increase in Resins and Chemicals sales, primarily due to the phenol plant
acquisition; offset by lower sales in Fluorine Products primarily due to unfavorable pricing
reflecting more challenging global end market conditions and the unfavorable impact of foreign
exchange. We expect challenging global end market conditions to continue in the first quarter of
2013.
PMT segment profit increased by 11 percent in 2012 compared with 2011 due to a 9 percent
increase in operational segment profit (net of a 10 percent decrease in the fourth quarter due to the
factors described below) and a 3 percent increase from acquisitions partially offset by an unfavorable
impact of 1 percent in foreign exchange. The increase in operational segment profit is primarily due to
higher licensing, catalyst and equipment revenues in UOP and productivity (net of continued
investment in growth initiatives) partially offset by unfavorable pricing in Fluorine Products and Resins
and Chemicals reflecting more challenging global end market conditions. Cost of products and services
sold totaled $4.5 billion in 2012, an increase of $392 million which is primarily due to acquisitions,
higher volume and continued investment in growth initiatives partially offset by productivity and the
favorable impact of foreign exchange.
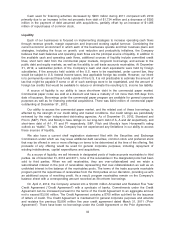
In July 2012, the Company announced that it is evaluating a series of upgrades to its Metropolis
Works nuclear conversion facility, a Fluorine Products facility, following a U.S. Nuclear Regulatory
Commission (NRC) inspection that focused on preparedness for extreme natural disasters such as
strong earthquakes and tornados. The NRC inspection was part of a comprehensive assessment of all
U.S. nuclear-related facilities following the Fukushima, Japan earthquake in 2011. Production at the
Metropolis facility was suspended following the NRC inspection and will not resume until certain
seismic-related upgrades have been implemented by the Company and reviewed by the NRC. The
scope of these upgrades has been defined in a Confirmatory Order issued by the NRC to Honeywell
on October 16, 2012. The Company believes that completion of the upgrades to the facility could be
completed by the third quarter of 2013. The continued suspension of operations and the cost of the
plant upgrades are not expected to have a material negative impact on Performance Materials and
Technologies’ 2013 results of operations.
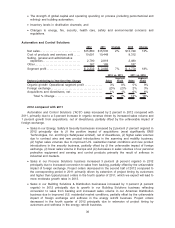
2011 compared with 2010
PMT sales increased by 20 percent in 2011 compared with 2010 due to a 16 percent increase in
organic growth, 3 percent growth from acquisitions, and a 1 percent favorable impact of foreign
exchange.
•UOP sales increased by 24 percent in 2011 compared to 2010 primarily driven by increased
service, and licensing revenues and higher unit sales of refining and specialty catalysts,
primarily reflecting continued strength in the refining and petrochemical industries.
•Advanced Materials sales increased by 18 percent (12 percent organically) in 2011 compared to
2010 primarily driven by (i) a 33 percent (18 percent organically) increase in Resins and
Chemicals sales primarily due to higher prices driven by strong Asia demand, agricultural
demand, formula pricing arrangements and increased sales resulting from the acquisition of a
phenol plant, partially offset by decreased volumes primarily due to disruptions in phenol supply
and weather related events, (ii) a 10 percent increase in our Fluorine Products business due to
higher pricing reflecting robust global demand and tight industry supply conditions primarily in
the first half of the year, which moderated in the second half of the year due to seasonally
weaker demand and increased available capacity in the marketplace, and (iii) a 12 percent
increase in Specialty Products sales primarily due to higher sales volume in our armor,
additives, and healthcare packaging products, and commercial excellence initiatives. We expect
Advanced Materials sales growth to continue to moderate during the first half of 2012 due to
39