Honeywell 2012 Annual Report Download - page 121
Download and view the complete annual report
Please find page 121 of the 2012 Honeywell annual report below. You can navigate through the pages in the report by either clicking on the pages listed below, or by using the keyword search tool below to find specific information within the annual report.-
 1
1 -
2
-
3
-
4
-
5
-
6
-
7
-
8
-
9
-
10
-
11
-
12
-
13
-
14
-
15
-
16
-
17
-
18
-
19
-
20
-
21
-
22
-
23
-
24
-
25
-
26
-
27
-
28
-
29
-
30
-
31
-
32
-
33
-
34
-
35
-
36
-
37
-
38
-
39
-
40
-
41
-
42
-
43
-
44
-
45
-
46
-
47
-
48
-
49
-
50
-
51
-
52
-
53
-
54
-
55
-
56
-
57
-
58
-
59
-
60
-
61
-
62
-
63
-
64
-
65
-
66
-
67
-
68
-
69
-
70
-
71
-
72
-
73
-
74
-
75
-
76
-
77
-
78
-
79
-
80
-
81
-
82
-
83
-
84
-
85
-
86
-
87
-
88
-
89
-
90
-
91
-
92
-
93
-
94
-
95
-
96
-
97
-
98
-
99
-
100
-
101
-
102
-
103
-
104
-
105
-
106
-
107
-
108
-
109
-
110
-
 111
111 -
 112
112 -
 113
113 -
 114
114 -
 115
115 -
 116
116 -
 117
117 -
 118
118 -
 119
119 -
 120
120 -
 121
121 -
 122
122 -
 123
123 -
 124
124 -
 125
125 -
 126
126 -
 127
127 -
 128
128 -
 129
129 -
 130
130 -
 131
131 -
132
-
133
-
134
-
135
-
136
-
137
-
138
-
139
-
140
-
141
 |
 |

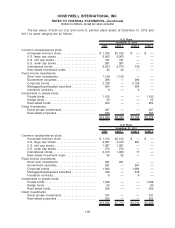
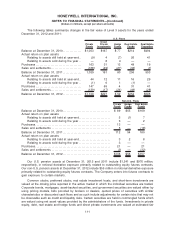
value based on quarterly financial information received from the investment advisor and/or general
partner. Investments in real estate properties are valued on a quarterly basis using the income
approach. Valuation estimates are periodically supplemented by third party appraisals.
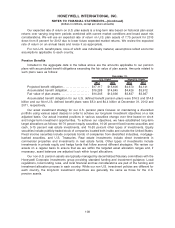
Our general funding policy for qualified pension plans is to contribute amounts at least sufficient to
satisfy regulatory funding standards. In 2012, 2011 and 2010, we were not required to make
contributions to our U.S. pension plans, however, we made voluntary contributions of $792, $1,650 and
$1,000 million, respectively, primarily to improve the funded status of our plans. These contributions do
not reflect benefits paid directly from Company assets. In 2013, we expect to make cash contributions
of approximately $150 million ($113 million was made in January 2013) to our non-U.S. defined benefit
pension plans to satisfy regulatory funding standards. We do not have any required contributions for
our U.S. defined benefit pension plans in 2013.
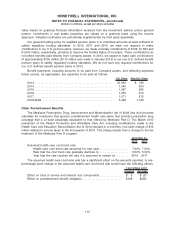
Benefit payments, including amounts to be paid from Company assets, and reflecting expected
future service, as appropriate, are expected to be paid as follows:
U.S. Plans Non-U.S. Plans
2013. . . . . . . . . . . . . . . . . . . . . . . . . . . . . . . . . . . . . . . . . . . . . . . . . . . . . . . . . . $1,043 $ 196
2014. . . . . . . . . . . . . . . . . . . . . . . . . . . . . . . . . . . . . . . . . . . . . . . . . . . . . . . . . . 1,045 200
2015. . . . . . . . . . . . . . . . . . . . . . . . . . . . . . . . . . . . . . . . . . . . . . . . . . . . . . . . . . 1,087 205
2016. . . . . . . . . . . . . . . . . . . . . . . . . . . . . . . . . . . . . . . . . . . . . . . . . . . . . . . . . . 1,075 210
2017. . . . . . . . . . . . . . . . . . . . . . . . . . . . . . . . . . . . . . . . . . . . . . . . . . . . . . . . . . 1,071 215
2018-2022 . . . . . . . . . . . . . . . . . . . . . . . . . . . . . . . . . . . . . . . . . . . . . . . . . . . . 5,448 1,162
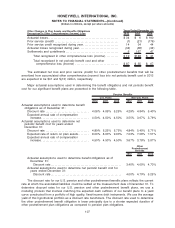
Other Postretirement Benefits
The Medicare Prescription Drug, Improvement and Modernization Act of 2003 (the Act) provides
subsidies for employers that sponsor postretirement health care plans that provide prescription drug
coverage that is at least actuarially equivalent to that offered by Medicare Part D. The March 2010
enactment of the Patient Protection and Affordable Care Act, including modifications made in the
Health Care and Education Reconciliation Act of 2010 resulted in a one-time, non-cash charge of $13
million related to income taxes in the first quarter of 2010. The charge results from a change in the tax
treatment of the Medicare Part D program.
2012 2011
December 31,
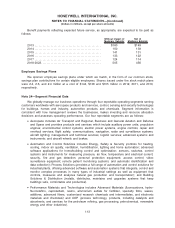
Assumed health care cost trend rate:
Health care cost trend rate assumed for next year . . . . . . . . . . . . . . . . . . . . . 7.00% 7.50%
Rate that the cost trend rate gradually declines to. . . . . . . . . . . . . . . . . . . . . . 5.00% 5.00%
Year that the rate reaches the rate it is assumed to remain at. . . . . . . . . . 2019 2017
The assumed health care cost trend rate has a significant effect on the amounts reported. A one-
percentage-point change in the assumed health care cost trend rate would have the following effects:
Increase Decrease
1 percentage point
Effect on total of service and interest cost components . . . . . . . . . . . . . . . . $ 5 $ (3)
Effect on postretirement benefit obligation . . . . . . . . . . . . . . . . . . . . . . . . . . . . . $158 $(82)
112
HONEYWELL INTERNATIONAL INC.
NOTES TO FINANCIAL STATEMENTS—(Continued)
(Dollars in millions, except per share amounts)