Honeywell 2012 Annual Report Download - page 2
Download and view the complete annual report
Please find page 2 of the 2012 Honeywell annual report below. You can navigate through the pages in the report by either clicking on the pages listed below, or by using the keyword search tool below to find specific information within the annual report.-
 1
1 -
 2
2 -
 3
3 -
 4
4 -
 5
5 -
 6
6 -
 7
7 -
 8
8 -
 9
9 -
 10
10 -
 11
11 -
 12
12 -
 13
13 -
14
-
15
-
16
-
17
-
18
-
19
-
20
-
21
-
22
-
23
-
24
-
25
-
26
-
27
-
28
-
29
-
30
-
31
-
32
-
33
-
34
-
35
-
36
-
37
-
38
-
39
-
40
-
41
-
42
-
43
-
44
-
45
-
46
-
47
-
48
-
49
-
50
-
51
-
52
-
53
-
54
-
55
-
56
-
57
-
58
-
59
-
60
-
61
-
62
-
63
-
64
-
65
-
66
-
67
-
68
-
69
-
70
-
71
-
72
-
73
-
74
-
75
-
76
-
77
-
78
-
79
-
80
-
81
-
82
-
83
-
84
-
85
-
86
-
87
-
88
-
89
-
90
-
91
-
92
-
93
-
94
-
95
-
96
-
97
-
98
-
99
-
100
-
101
-
102
-
103
-
104
-
105
-
106
-
107
-
108
-
109
-
110
-
111
-
112
-
113
-
114
-
115
-
116
-
117
-
118
-
119
-
120
-
121
-
122
-
123
-
124
-
125
-
126
-
127
-
128
-
129
-
130
-
131
-
132
-
133
-
134
-
135
-
136
-
137
-
138
-
139
-
140
-
141
 |
 |
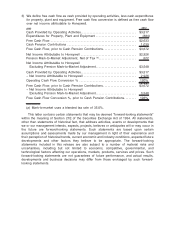
SHAREOWNER LETTER 2013
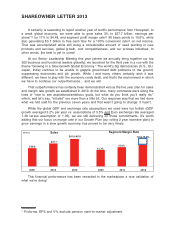
It certainly is rewarding to report another year of terrific performance from Honeywell. In
a weak global economy, we were able to grow sales 3% to $37.7 billion, earnings per
share*(1) by 11% to $4.48, and segment profit margin rate(2) 90 basis points to 15.6%, while
also generating $3.7 billion in free cash flow for a 103% conversion rate(3) on net income.
That was accomplished while still doing a considerable amount of seed planting in new
products and services, global growth, cost competitiveness, and our process initiatives. In
other words, the best is yet to come!
At our Senior Leadership Meeting this year (where we annually bring together our top
300 business and functional leaders globally), we launched for the third year in a row with the
theme “Growing in a Slow Growth Global Economy.” The world’s big democracies (U.S., EU,
Japan, India) continue to be unable to grapple government debt problems to the ground,
suppressing economies and job growth. While I and many others certainly wish it was
different, we have to play with the economic cards dealt, and that’s the environment in which
we have to continue our outperformance… and we will.
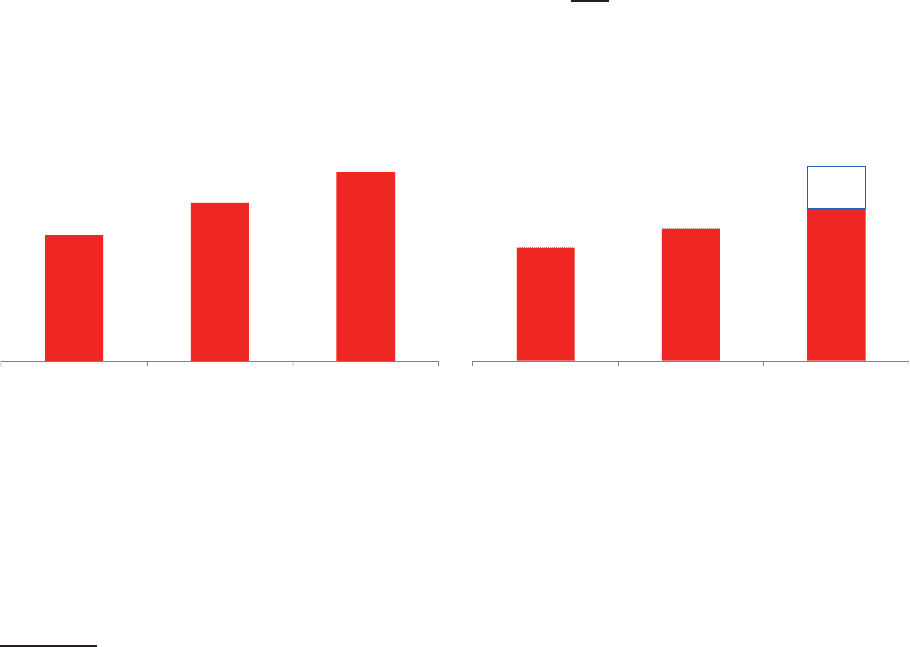
That outperformance has certainly been demonstrated versus the five year plan for sales
and margin rate growth we established in 2010. At the time, many comments were along the
lines of “nice to see aspirational/ambitious goals, but what do you think you’ll really do,”
which, well let’s say, “irritated” me more than a little bit. Our response was that we had done
what we had said for the previous seven years and that wasn’t going to change. It hasn’t.
While the global GDP and exchange rate assumptions we used were too bullish (GDP
growth averaged 3.2% per year vs. assumptions of 3.5% and Euro exchange rate averaged
1.30 versus assumption of 1.35), we are still delivering on those commitments. It’s worth
adding that our focus on margin rate in our Growth Plan (our rolling 2 year incentive plan) to
grow earnings in a slow growth economy has proved to be very timely.
Sales
$41.0-45.0
$30.0
2009 2012 2014
$37.7
(Billions)
Segment Margin Rate
13.3%
15.6%
16.0-18.0%
2009 2012 2014
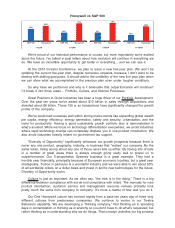
This financial performance has been rewarded in the marketplace a nice validation of
what we’re doing!
* Proforma, EPS and V% exclude pension mark-to-market adjustment.