Honeywell 2012 Annual Report Download - page 126
Download and view the complete annual report
Please find page 126 of the 2012 Honeywell annual report below. You can navigate through the pages in the report by either clicking on the pages listed below, or by using the keyword search tool below to find specific information within the annual report.-
 1
1 -
2
-
3
-
4
-
5
-
6
-
7
-
8
-
9
-
10
-
11
-
12
-
13
-
14
-
15
-
16
-
17
-
18
-
19
-
20
-
21
-
22
-
23
-
24
-
25
-
26
-
27
-
28
-
29
-
30
-
31
-
32
-
33
-
34
-
35
-
36
-
37
-
38
-
39
-
40
-
41
-
42
-
43
-
44
-
45
-
46
-
47
-
48
-
49
-
50
-
51
-
52
-
53
-
54
-
55
-
56
-
57
-
58
-
59
-
60
-
61
-
62
-
63
-
64
-
65
-
66
-
67
-
68
-
69
-
70
-
71
-
72
-
73
-
74
-
75
-
76
-
77
-
78
-
79
-
80
-
81
-
82
-
83
-
84
-
85
-
86
-
87
-
88
-
89
-
90
-
91
-
92
-
93
-
94
-
95
-
96
-
97
-
98
-
99
-
100
-
101
-
102
-
103
-
104
-
105
-
106
-
107
-
108
-
109
-
110
-
111
-
112
-
113
-
114
-
115
-
 116
116 -
 117
117 -
 118
118 -
 119
119 -
 120
120 -
 121
121 -
 122
122 -
 123
123 -
 124
124 -
 125
125 -
 126
126 -
 127
127 -
 128
128 -
 129
129 -
 130
130 -
 131
131 -
 132
132 -
 133
133 -
 134
134 -
 135
135 -
 136
136 -
137
-
138
-
139
-
140
-
141
 |
 |

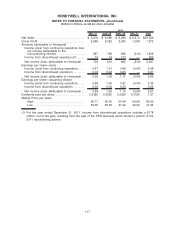
Mar. 31 June 30 Sept. 30 Dec. 31 Year
2011
Net Sales . . . . . . . . . . . . . . . . . . . . . . . . . . . . . . . . . . . . $ 8,672 $ 9,086 $ 9,298 $ 9,473 $36,529
Gross Profit . . . . . . . . . . . . . . . . . . . . . . . . . . . . . . . . . . 2,248 2,422 2,265 1,038 7,973
Amounts attributable to Honeywell
Income (loss) from continuing operations less
net income attributable to the
noncontrolling interest. . . . . . . . . . . . . . . . . . . . . 687 796 685 (310) 1,858
Income from discontinued operations(1). . . . . . 18 14 177 — 209
Net income (loss) attributable to Honeywell . . 705 810 862 (310) 2,067
Earnings per share—basic
Income (loss) from continuing operations. . . . . 0.87 1.01 0.88 (0.40) 2.38
Income from discontinued operations . . . . . . . . 0.03 0.02 0.23 — 0.27
Net income (loss) attributable to Honeywell . . 0.90 1.03 1.11 (0.40) 2.65
Earnings per share—assuming dilution
Income (loss) from continuing operations. . . . . 0.86 1.00 0.87 (0.40) 2.35
Income from discontinued operations . . . . . . . . 0.02 0.02 0.23 — 0.26
Net income (loss) attributable to Honeywell . . 0.88 1.02 1.10 (0.40) 2.61
Dividends paid per share . . . . . . . . . . . . . . . . . . . . . . 0.3325 0.3325 0.3325 0.3725 1.37
Market Price per share
High . . . . . . . . . . . . . . . . . . . . . . . . . . . . . . . . . . . . . 59.71 62.00 60.44 54.98 62.00
Low . . . . . . . . . . . . . . . . . . . . . . . . . . . . . . . . . . . . . . 53.48 55.53 41.94 42.32 41.94
(1) For the year ended December 31, 2011, Income from discontinued operations includes a $178
million, net of tax gain, resulting from the sale of the CPG business which funded a portion of the
2011 repositioning actions.
117
HONEYWELL INTERNATIONAL INC.
NOTES TO FINANCIAL STATEMENTS—(Continued)
(Dollars in millions, except per share amounts)