Honeywell 2012 Annual Report Download - page 33
Download and view the complete annual report
Please find page 33 of the 2012 Honeywell annual report below. You can navigate through the pages in the report by either clicking on the pages listed below, or by using the keyword search tool below to find specific information within the annual report.-
 1
1 -
2
-
3
-
4
-
5
-
6
-
7
-
8
-
9
-
10
-
11
-
12
-
13
-
14
-
15
-
16
-
17
-
18
-
19
-
20
-
21
-
22
-
 23
23 -
 24
24 -
 25
25 -
 26
26 -
 27
27 -
 28
28 -
 29
29 -
 30
30 -
 31
31 -
 32
32 -
 33
33 -
 34
34 -
 35
35 -
 36
36 -
 37
37 -
 38
38 -
 39
39 -
 40
40 -
 41
41 -
 42
42 -
 43
43 -
44
-
45
-
46
-
47
-
48
-
49
-
50
-
51
-
52
-
53
-
54
-
55
-
56
-
57
-
58
-
59
-
60
-
61
-
62
-
63
-
64
-
65
-
66
-
67
-
68
-
69
-
70
-
71
-
72
-
73
-
74
-
75
-
76
-
77
-
78
-
79
-
80
-
81
-
82
-
83
-
84
-
85
-
86
-
87
-
88
-
89
-
90
-
91
-
92
-
93
-
94
-
95
-
96
-
97
-
98
-
99
-
100
-
101
-
102
-
103
-
104
-
105
-
106
-
107
-
108
-
109
-
110
-
111
-
112
-
113
-
114
-
115
-
116
-
117
-
118
-
119
-
120
-
121
-
122
-
123
-
124
-
125
-
126
-
127
-
128
-
129
-
130
-
131
-
132
-
133
-
134
-
135
-
136
-
137
-
138
-
139
-
140
-
141
 |
 |

HONEYWELL INTERNATIONAL INC.
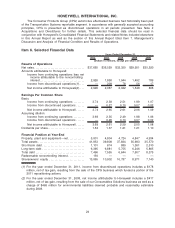
The Consumer Products Group (CPG) automotive aftermarket business had historically been part
of the Transportation Systems reportable segment. In accordance with generally accepted accounting
principles, CPG is presented as discontinued operations in all periods presented. See Note 2
Acquisitions and Divestitures for further details. This selected financial data should be read in
conjunction with Honeywell’s Consolidated Financial Statements and related Notes included elsewhere
in this Annual Report as well as the section of this Annual Report titled Item 7. Management’s
Discussion and Analysis of Financial Condition and Results of Operations.
Item 6. Selected Financial Data
2012 2011 2010 2009 2008
Years Ended December 31,
(Dollars in millions, except per share amounts)
Results of Operations
Net sales . . . . . . . . . . . . . . . . . . . . . . . . . . . . . . . . . . . . . $37,665 $36,529 $32,350 $29,951 $35,520
Amounts attributable to Honeywell:
Income from continuing operations less net
income attributable to the noncontrolling
interest. . . . . . . . . . . . . . . . . . . . . . . . . . . . . . . . . 2,926 1,858 1,944 1,492 789
Income from discontinued operations(1). . . . — 209 78 56 17
Net income attributable to Honeywell(2). . . . 2,926 2,067 2,022 1,548 806
Earnings Per Common Share
Basic:
Income from continuing operations . . . . . . . . 3.74 2.38 2.51 1.99 1.07
Income from discontinued operations . . . . . . — 0.27 0.10 0.07 0.02
Net income attributable to Honeywell . . . . . . 3.74 2.65 2.61 2.06 1.09
Assuming dilution:
Income from continuing operations . . . . . . . . 3.69 2.35 2.49 1.98 1.06
Income from discontinued operations . . . . . . — 0.26 0.10 0.07 0.02
Net income attributable to Honeywell . . . . . . 3.69 2.61 2.59 2.05 1.08
Dividends per share. . . . . . . . . . . . . . . . . . . . . . . . . . . 1.53 1.37 1.21 1.21 1.10
Financial Position at Year-End
Property, plant and equipment—net. . . . . . . . . . . . 5,001 4,804 4,724 4,847 4,934
Total assets . . . . . . . . . . . . . . . . . . . . . . . . . . . . . . . . . . 41,853 39,808 37,834 35,993 35,570
Short-term debt . . . . . . . . . . . . . . . . . . . . . . . . . . . . . . . 1,101 674 889 1,361 2,510
Long-term debt . . . . . . . . . . . . . . . . . . . . . . . . . . . . . . . 6,395 6,881 5,755 6,246 5,865
Total debt . . . . . . . . . . . . . . . . . . . . . . . . . . . . . . . . . . . . 7,496 7,555 6,644 7,607 8,375
Redeemable noncontrolling interest . . . . . . . . . . . . 150 — — — —
Shareowners’ equity . . . . . . . . . . . . . . . . . . . . . . . . . . 13,065 10,902 10,787 8,971 7,140
(1) For the year ended December 31, 2011, income from discontinued operations includes a $178
million, net of tax gain, resulting from the sale of the CPG business which funded a portion of the
2011 repositioning actions.
(2) For the year ended December 31, 2008, net income attributable to Honeywell includes a $417
million, net of tax gain, resulting from the sale of our Consumables Solutions business as well as a
charge of $465 million for environmental liabilities deemed probable and reasonably estimable
during 2008.
24