Honeywell 2012 Annual Report Download - page 7
Download and view the complete annual report
Please find page 7 of the 2012 Honeywell annual report below. You can navigate through the pages in the report by either clicking on the pages listed below, or by using the keyword search tool below to find specific information within the annual report.-
 1
1 -
 2
2 -
 3
3 -
 4
4 -
 5
5 -
 6
6 -
 7
7 -
 8
8 -
 9
9 -
 10
10 -
 11
11 -
 12
12 -
 13
13 -
 14
14 -
 15
15 -
 16
16 -
 17
17 -
 18
18 -
19
-
20
-
21
-
22
-
23
-
24
-
25
-
26
-
27
-
28
-
29
-
30
-
31
-
32
-
33
-
34
-
35
-
36
-
37
-
38
-
39
-
40
-
41
-
42
-
43
-
44
-
45
-
46
-
47
-
48
-
49
-
50
-
51
-
52
-
53
-
54
-
55
-
56
-
57
-
58
-
59
-
60
-
61
-
62
-
63
-
64
-
65
-
66
-
67
-
68
-
69
-
70
-
71
-
72
-
73
-
74
-
75
-
76
-
77
-
78
-
79
-
80
-
81
-
82
-
83
-
84
-
85
-
86
-
87
-
88
-
89
-
90
-
91
-
92
-
93
-
94
-
95
-
96
-
97
-
98
-
99
-
100
-
101
-
102
-
103
-
104
-
105
-
106
-
107
-
108
-
109
-
110
-
111
-
112
-
113
-
114
-
115
-
116
-
117
-
118
-
119
-
120
-
121
-
122
-
123
-
124
-
125
-
126
-
127
-
128
-
129
-
130
-
131
-
132
-
133
-
134
-
135
-
136
-
137
-
138
-
139
-
140
-
141
 |
 |

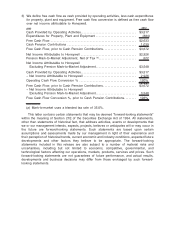
3) We define free cash flow as cash provided by operating activities, less cash expenditures
for property, plant and equipment. Free cash flow conversion is defined as free cash flow
over net income attributable to Honeywell.
($M) 2012
Cash Provided by Operating Activities..................................... $3,517
Expenditures for Property, Plant and Equipment ........................... (884)
Free Cash Flow.......................................................... $2,633
Cash Pension Contributions . . ............................................ 1,039
Free Cash Flow, prior to Cash Pension Contributions ...................... $3,672
Net Income Attributable to Honeywell ..................................... $2,926
Pension Mark-to-Market Adjustment, Net of Tax (a)......................... 622
Net Income Attributable to Honeywell
Excluding Pension Mark-to-Market Adjustment........................... $3,548
Cash Provided by Operating Activities..................................... $3,517
÷Net Income Attributable to Honeywell ................................... 2,926
Operating Cash Flow Conversion % . ..................................... 120%
Free Cash Flow, prior to Cash Pension Contributions ...................... $3,672
÷Net Income Attributable to Honeywell
Excluding Pension Mark-to-Market Adjustment........................... 3,548
Free Cash Flow Conversion %, prior to Cash Pension Contributions........ 103%
(a) Mark-to-market uses a blended tax rate of 35.0%.
This letter contains certain statements that may be deemed “forward-looking statements”
within the meaning of Section 21E of the Securities Exchange Act of 1934. All statements,
other than statements of historical fact, that address activities, events or developments that
we or our management intends, expects, projects, believes or anticipates will or may occur in
the future are forward-looking statements. Such statements are based upon certain
assumptions and assessments made by our management in light of their experience and
their perception of historical trends, current economic and industry conditions, expected future
developments and other factors they believe to be appropriate. The forward-looking
statements included in this release are also subject to a number of material risks and
uncertainties, including but not limited to economic, competitive, governmental, and
technological factors affecting our operations, markets, products, services and prices. Such
forward-looking statements are not guarantees of future performance, and actual results,
developments and business decisions may differ from those envisaged by such forward-
looking statements.