Honeywell 2012 Annual Report Download - page 35
Download and view the complete annual report
Please find page 35 of the 2012 Honeywell annual report below. You can navigate through the pages in the report by either clicking on the pages listed below, or by using the keyword search tool below to find specific information within the annual report.-
 1
1 -
2
-
3
-
4
-
5
-
6
-
7
-
8
-
9
-
10
-
11
-
12
-
13
-
14
-
15
-
16
-
17
-
18
-
19
-
20
-
21
-
22
-
23
-
24
-
 25
25 -
 26
26 -
 27
27 -
 28
28 -
 29
29 -
 30
30 -
 31
31 -
 32
32 -
 33
33 -
 34
34 -
 35
35 -
 36
36 -
 37
37 -
 38
38 -
 39
39 -
 40
40 -
 41
41 -
 42
42 -
 43
43 -
 44
44 -
 45
45 -
46
-
47
-
48
-
49
-
50
-
51
-
52
-
53
-
54
-
55
-
56
-
57
-
58
-
59
-
60
-
61
-
62
-
63
-
64
-
65
-
66
-
67
-
68
-
69
-
70
-
71
-
72
-
73
-
74
-
75
-
76
-
77
-
78
-
79
-
80
-
81
-
82
-
83
-
84
-
85
-
86
-
87
-
88
-
89
-
90
-
91
-
92
-
93
-
94
-
95
-
96
-
97
-
98
-
99
-
100
-
101
-
102
-
103
-
104
-
105
-
106
-
107
-
108
-
109
-
110
-
111
-
112
-
113
-
114
-
115
-
116
-
117
-
118
-
119
-
120
-
121
-
122
-
123
-
124
-
125
-
126
-
127
-
128
-
129
-
130
-
131
-
132
-
133
-
134
-
135
-
136
-
137
-
138
-
139
-
140
-
141
 |
 |

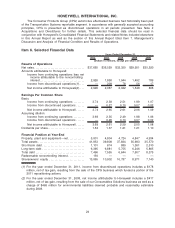
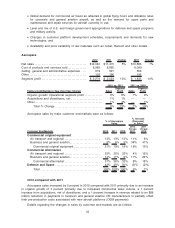
•Capital expenditures grew 11 percent to $884 million including the construction or expansion of
technology centers in India and Saudi Arabia.
•The Company recognized approximately $119 million of restructuring actions to support
sustainable productivity in years to come.
•The Company completed $438 million (net of cash acquired) in acquisitions in 2012, including
acquisition of a 70 percent ownership interest in Thomas Russell L.L.C. (“Thomas Russell Co.”),
a leader in technology and equipment for natural gas processing and treating, primarily serving
the US market.
•Expansion of Honeywell’s presence and sales in high growth regions and countries such as
China, India, Eastern Europe, the Middle-East, and Latin America. Sales to customers outside
the United States now account for approximately 55 percent of total revenues.
Operating cash flow grew by 24 percent in 2012 to $3,517 million. This operating cash flow
performance enabled us to invest $884 million in capital expenditures, fund the acquisitions discussed
above, make $1,039 million in pension contributions, and provide an 11 percent increase in dividends
paid (vs. 2011) and repurchase 5 million shares of common stock.
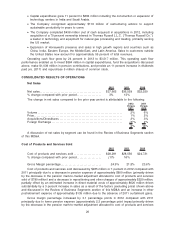
CONSOLIDATED RESULTS OF OPERATIONS
Net Sales
2012 2011 2010
Net sales . . . . . . . . . . . . . . . . . . . . . . . . . . . . . . . . . . . . . . . . . . . . . $37,665 $36,529 $32,350
% change compared with prior period. . . . . . . . . . . . . . . . . . 3% 13%
The change in net sales compared to the prior year period is attributable to the following:
2012
Versus
2011
2011
Versus
2010
Volume . . . . . . . . . . . . . . . . . . . . . . . . . . . . . . . . . . . . . . . . . . . . . . . . . . . . . . . . . . . . . . 2% 6%
Price. . . . . . . . . . . . . . . . . . . . . . . . . . . . . . . . . . . . . . . . . . . . . . . . . . . . . . . . . . . . . . . . . 1% 2%
Acquisitions/Divestitures . . . . . . . . . . . . . . . . . . . . . . . . . . . . . . . . . . . . . . . . . . . . . . 2% 3%
Foreign Exchange . . . . . . . . . . . . . . . . . . . . . . . . . . . . . . . . . . . . . . . . . . . . . . . . . . . . (2)% 2%
3% 13%
A discussion of net sales by segment can be found in the Review of Business Segments section
of this MD&A.
Cost of Products and Services Sold
2012 2011 2010
Cost of products and services sold . . . . . . . . . . . . . . . . . . . . $28,291 $28,556 $24,721
% change compared with prior period. . . . . . . . . . . . . . . . . . (1)% 16%
Gross Margin percentage. . . . . . . . . . . . . . . . . . . . . . . . . . . . . . 24.9% 21.8% 23.6%
Cost of products and services sold decreased by $265 million or 1 percent in 2012 compared with
2011 principally due to a decrease in pension expense of approximately $800 million (primarily driven
by the decrease in the pension mark-to-market adjustment allocated to cost of products and services
sold of $780 million) and a decrease in repositioning and other charges of approximately $220 million,
partially offset by an estimated increase in direct material costs of approximately $620 million driven
substantially by a 3 percent increase in sales as a result of the factors (excluding price) shown above
and discussed in the Review of Business Segments section of this MD&A and an increase in other
postretirement expense of approximately $135 million due to the absence of 2011 curtailment gains.
Gross margin percentage increased by 3.1 percentage points in 2012 compared with 2011
principally due to lower pension expense (approximately 2.2 percentage point impact primarily driven
by the decrease in the pension mark-to-market adjustment allocated to cost of products and services
26