Honeywell 2012 Annual Report Download - page 46
Download and view the complete annual report
Please find page 46 of the 2012 Honeywell annual report below. You can navigate through the pages in the report by either clicking on the pages listed below, or by using the keyword search tool below to find specific information within the annual report.-
 1
1 -
2
-
3
-
4
-
5
-
6
-
7
-
8
-
9
-
10
-
11
-
12
-
13
-
14
-
15
-
16
-
17
-
18
-
19
-
20
-
21
-
22
-
23
-
24
-
25
-
26
-
27
-
28
-
29
-
30
-
31
-
32
-
33
-
34
-
35
-
 36
36 -
 37
37 -
 38
38 -
 39
39 -
 40
40 -
 41
41 -
 42
42 -
 43
43 -
 44
44 -
 45
45 -
 46
46 -
 47
47 -
 48
48 -
 49
49 -
 50
50 -
 51
51 -
 52
52 -
 53
53 -
 54
54 -
 55
55 -
 56
56 -
57
-
58
-
59
-
60
-
61
-
62
-
63
-
64
-
65
-
66
-
67
-
68
-
69
-
70
-
71
-
72
-
73
-
74
-
75
-
76
-
77
-
78
-
79
-
80
-
81
-
82
-
83
-
84
-
85
-
86
-
87
-
88
-
89
-
90
-
91
-
92
-
93
-
94
-
95
-
96
-
97
-
98
-
99
-
100
-
101
-
102
-
103
-
104
-
105
-
106
-
107
-
108
-
109
-
110
-
111
-
112
-
113
-
114
-
115
-
116
-
117
-
118
-
119
-
120
-
121
-
122
-
123
-
124
-
125
-
126
-
127
-
128
-
129
-
130
-
131
-
132
-
133
-
134
-
135
-
136
-
137
-
138
-
139
-
140
-
141
 |
 |
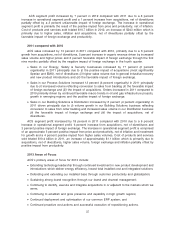
ACS segment profit increased by 7 percent in 2012 compared with 2011 due to a 8 percent
increase in operational segment profit and a 1 percent increase from acquisitions, net of divestitures
partially offset by a 2 percent unfavorable impact of foreign exchange. The increase in operational
segment profit is primarily the result of the positive impact from price and productivity, net of inflation.
Cost of products and services sold totaled $10.7 billion in 2012, an increase of $243 million which is
primarily due to higher sales, inflation and acquisitions, net of divestitures partially offset by the
favorable impact of foreign exchange and productivity.
2011 compared with 2010
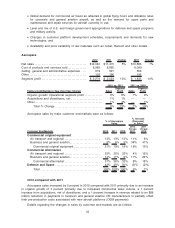
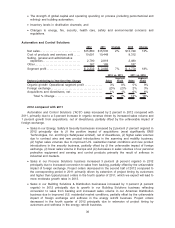
ACS sales increased by 13 percent in 2011 compared with 2010, primarily due to a 6 percent
growth from acquisitions, net of divestitures, 5 percent increase in organic revenue driven by increased
sales volume and higher prices and 2 percent favorable impact of foreign exchange through the first
nine months partially offset by the negative impact of foreign exchange in the fourth quarter.
•Sales in our Energy, Safety & Security businesses increased by 17 percent (6 percent
organically) in 2011 principally due to (i) the positive impact of acquisitions (most significantly
Sperian and EMS), net of divestitures (ii) higher sales volume due to general industrial recovery
and new product introductions and (iii) the favorable impact of foreign exchange.
•Sales in our Process Solutions increased 12 percent (6 percent organically) in 2011 principally
due to (i) increased volume reflecting conversion to sales from backlog (ii) the favorable impact
of foreign exchange and (iii) the impact of acquisitions. Orders increased in 2011 compared to
2010 primarily driven by continued favorable macro trends in oil and gas infrastructure projects,
growth in emerging regions and the positive impact of foreign exchange.
•Sales in our Building Solutions & Distribution increased by 6 percent (4 percent organically) in
2011 driven principally due to (i) volume growth in our Building Solutions business reflecting
conversion to sales from order backlog and increased sales volume in our Distribution business
(ii) the favorable impact of foreign exchange and (iii) the impact of acquisitions, net of
divestitures.
ACS segment profit increased by 18 percent in 2011 compared with 2010 due to a 9 percent
increase in operational segment profit, 6 percent increase from acquisitions, net of divestitures and
3 percent positive impact of foreign exchange. The increase in operational segment profit is comprised
of an approximate 5 percent positive impact from price and productivity, net of inflation and investment
for growth and a 4 percent positive impact from higher sales volumes. Cost of products and services
sold totaled $10.4 billion in 2011, an increase of approximately $1.1 billion which is primarily due to
acquisitions, net of divestitures, higher sales volume, foreign exchange and inflation partially offset by
positive impact from productivity.
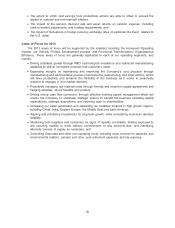
2013 Areas of Focus
ACS’s primary areas of focus for 2013 include:
•Extending technology leadership through continued investment in new product development and
introductions which deliver energy efficiency, lowest total installed cost and integrated solutions;
•Defending and extending our installed base through customer productivity and globalization;
•Sustaining strong brand recognition through our brand and channel management;
•Continuing to identify, execute and integrate acquisitions in or adjacent to the markets which we
serve;
•Continuing to establish and grow presence and capability in high growth regions;
•Continued deployment and optimization of our common ERP system; and
•Continued proactive cost actions and successful execution of repositioning actions.
37